
يرجى استخدام متصفح الكمبيوتر الشخصي للوصول إلى التسجيل - تداول السعودية
حسنًا
Is Patrick Industries (PATK) Still Attractive After Strong Multi Year Share Price Gains
Patrick Industries, Inc. PATK | 113.14 113.14 | -1.66% 0.00% Pre |
Patrick Industries scores just 2/6 on our valuation checks. See what other red flags we found in the full valuation breakdown.
A Discounted Cash Flow, or DCF, model estimates what a business could be worth today by projecting its future cash flows and then discounting those back to a present value.
For Patrick Industries, the model used is a 2 Stage Free Cash Flow to Equity approach. The latest twelve month free cash flow is about $215.5 million. Simply Wall St uses analyst estimates where available, then extrapolates further out, with projected free cash flow of $292.85 million in 2026 and a series of estimates extending through 2035.
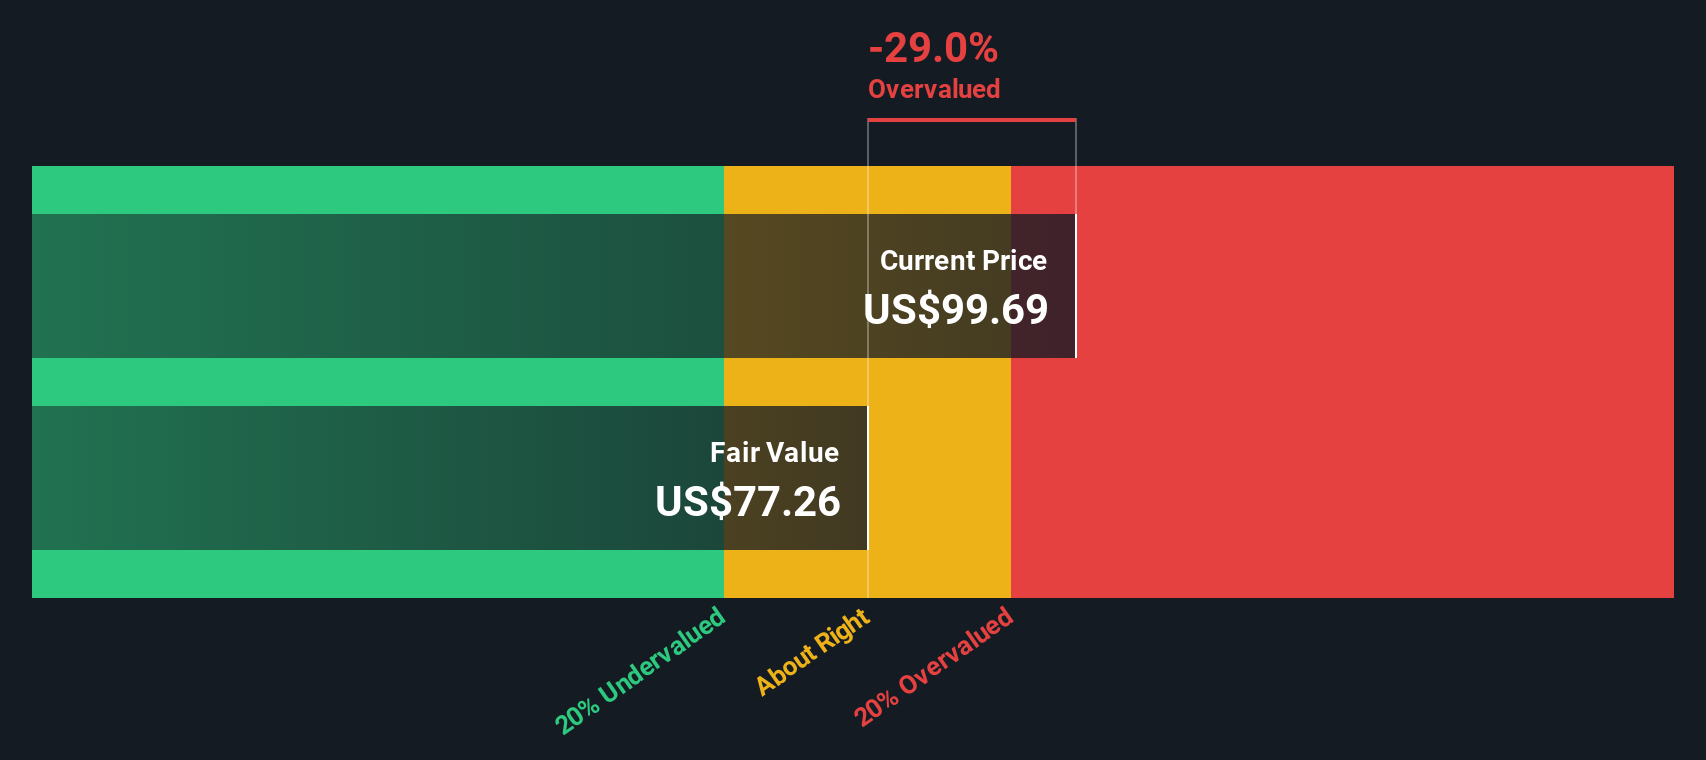
Each of these projected cash flows is discounted back to today and combined to produce an estimated intrinsic value per share of about $160.72. Compared with the recent share price of $115.93, the DCF output suggests the stock trades at a 27.9% discount to this estimate, which indicates potential undervaluation on this model.
Result: UNDERVALUED
Our Discounted Cash Flow (DCF) analysis suggests Patrick Industries is undervalued by 27.9%. Track this in your watchlist or portfolio, or discover 874 more undervalued stocks based on cash flows.
The P/E ratio is a common way to look at valuation for profitable companies because it ties the share price directly to the earnings that owners ultimately care about. You are essentially asking how many dollars you are paying today for one dollar of current earnings.
What counts as a “normal” P/E depends on what the market expects for future growth and how risky those earnings might be. Higher expected growth or lower perceived risk can support a higher P/E, while slower expected growth or higher uncertainty tends to line up with a lower P/E.
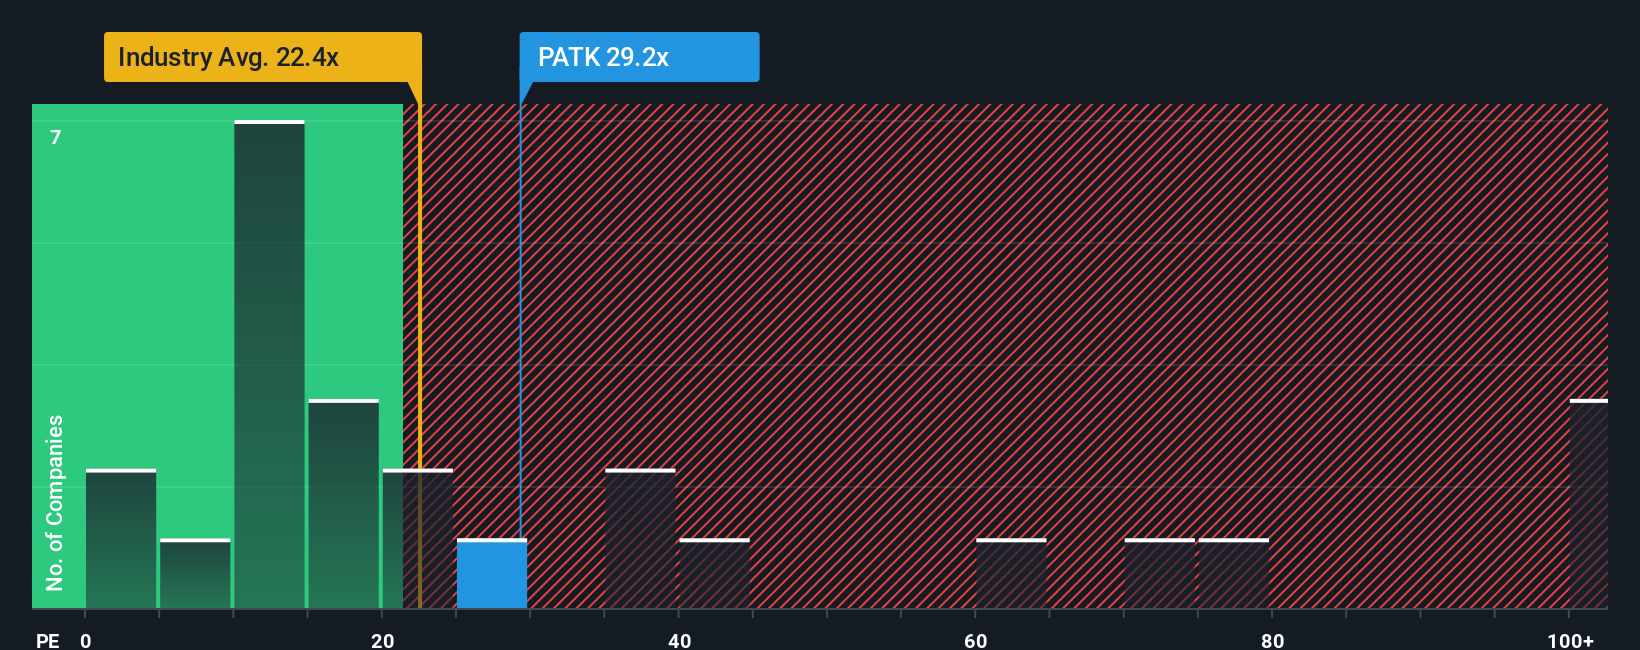
Patrick Industries currently trades on a P/E of 32.0x. That sits above the Auto Components industry average of 22.2x and the peer average of 23.0x. Simply Wall St also calculates a proprietary “Fair Ratio” of 18.5x. This is the P/E level suggested by factors such as Patrick Industries earnings growth profile, industry, profit margins, market cap and company specific risks.
This Fair Ratio can be more tailored than a simple comparison with peers or an industry average because it adjusts for company level characteristics rather than assuming every business deserves the same multiple. Comparing the current 32.0x P/E with the 18.5x Fair Ratio suggests Patrick Industries trades above this model implied level.
Result: OVERVALUED
P/E ratios tell one story, but what if the real opportunity lies elsewhere? Discover 1443 companies where insiders are betting big on explosive growth.
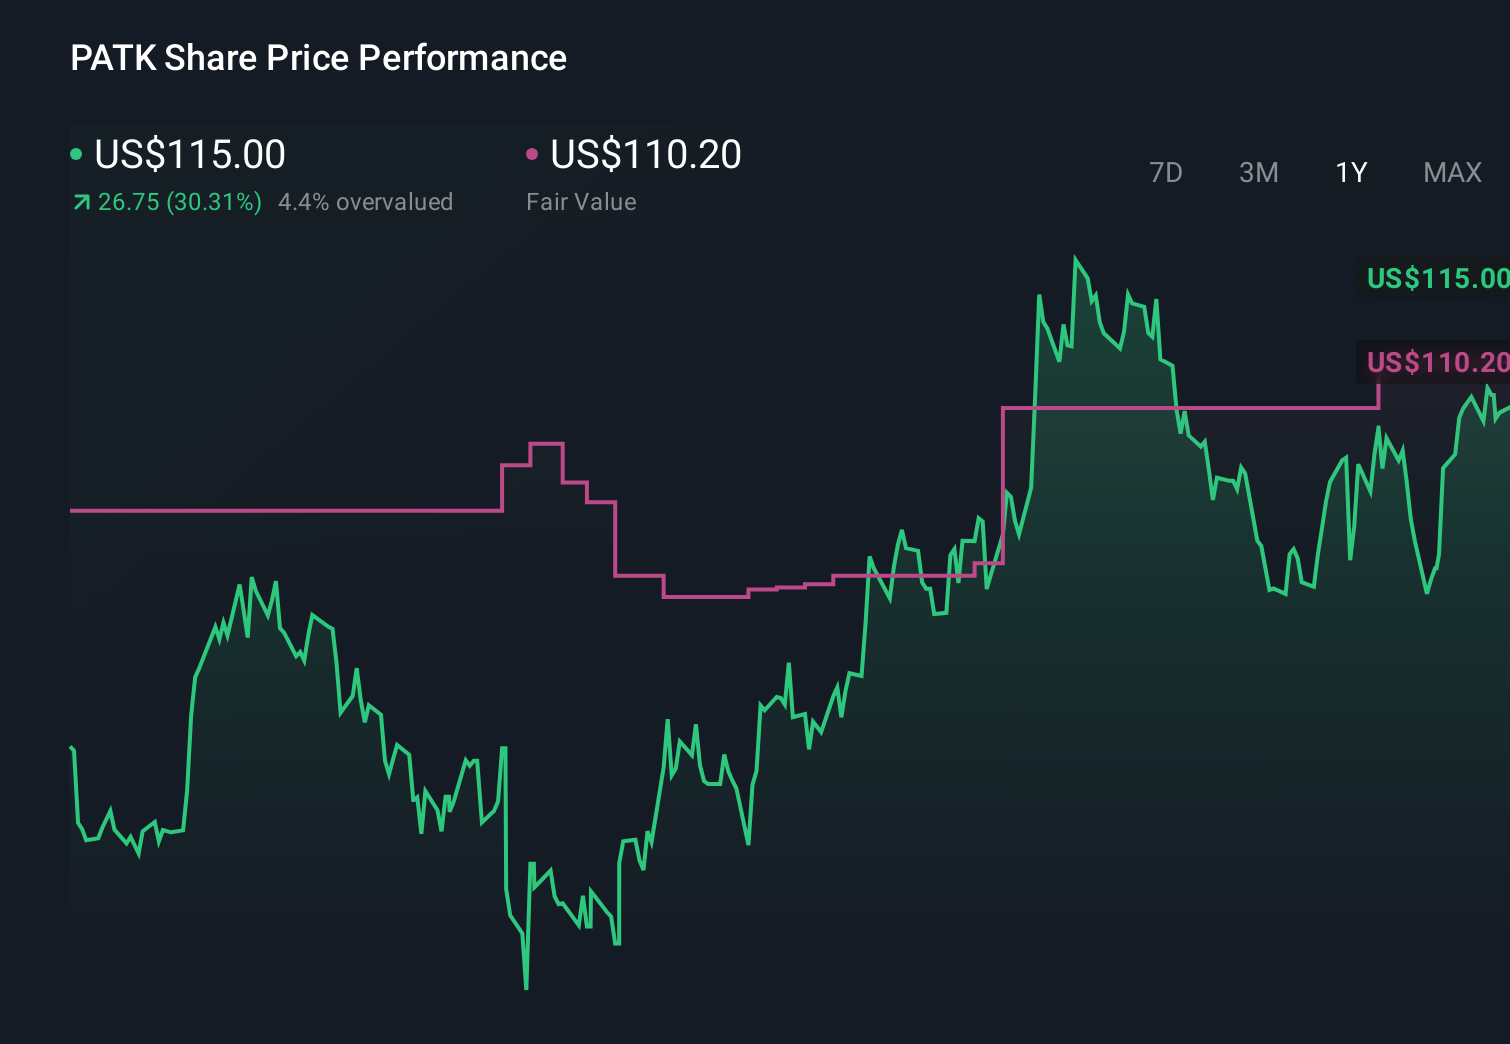
Earlier we mentioned that there is an even better way to think about valuation, and on Simply Wall St that comes through Narratives, where you set out your story for Patrick Industries, link that story to explicit forecasts for revenue, earnings and margins, and arrive at your own fair value that you can compare to the current price to help decide whether it looks attractive or stretched.
Narratives on the Community page are designed to be approachable. You can start from a clear thesis, plug in numbers that reflect what you believe is realistic, and see the implied fair value update as new information such as earnings or news is incorporated into the model.
For example, one Patrick Industries Narrative on the platform currently anchors on a fair value of about US$110.70 per share. Recent analyst style targets range from roughly US$95 at the cautious end to US$115 at the optimistic end. This shows how different investors can look at the same business and, based on their assumptions about future demand, margins and required return, arrive at different but transparent views of what the shares might be worth.
Do you think there's more to the story for Patrick Industries? Head over to our Community to see what others are saying!
This article by Simply Wall St is general in nature. We provide commentary based on historical data and analyst forecasts only using an unbiased methodology and our articles are not intended to be financial advice. It does not constitute a recommendation to buy or sell any stock, and does not take account of your objectives, or your financial situation. We aim to bring you long-term focused analysis driven by fundamental data. Note that our analysis may not factor in the latest price-sensitive company announcements or qualitative material. Simply Wall St has no position in any stocks mentioned.
