
يرجى استخدام متصفح الكمبيوتر الشخصي للوصول إلى التسجيل - تداول السعودية
حسنًا
Is Performance Food Group (PFGC) Pricing Reflecting Its Strong Multi Year Share Price Gains
Performance Food Group Co PFGC | 97.86 | +0.04% |
A Discounted Cash Flow, or DCF, model takes projected future cash flows and then discounts them back to today to estimate what the business might be worth right now. It is essentially asking what you would pay today for all the cash the company is expected to generate in the future.
For Performance Food Group, the latest twelve month Free Cash Flow is about $574.3 million. Based on analyst input for the next few years, followed by Simply Wall St extrapolations, projected Free Cash Flow reaches $1,466 million in 2030. Further estimates out to 2035 are also used, all discounted back using a 2 Stage Free Cash Flow to Equity model that focuses on cash available to shareholders after debt and other obligations.
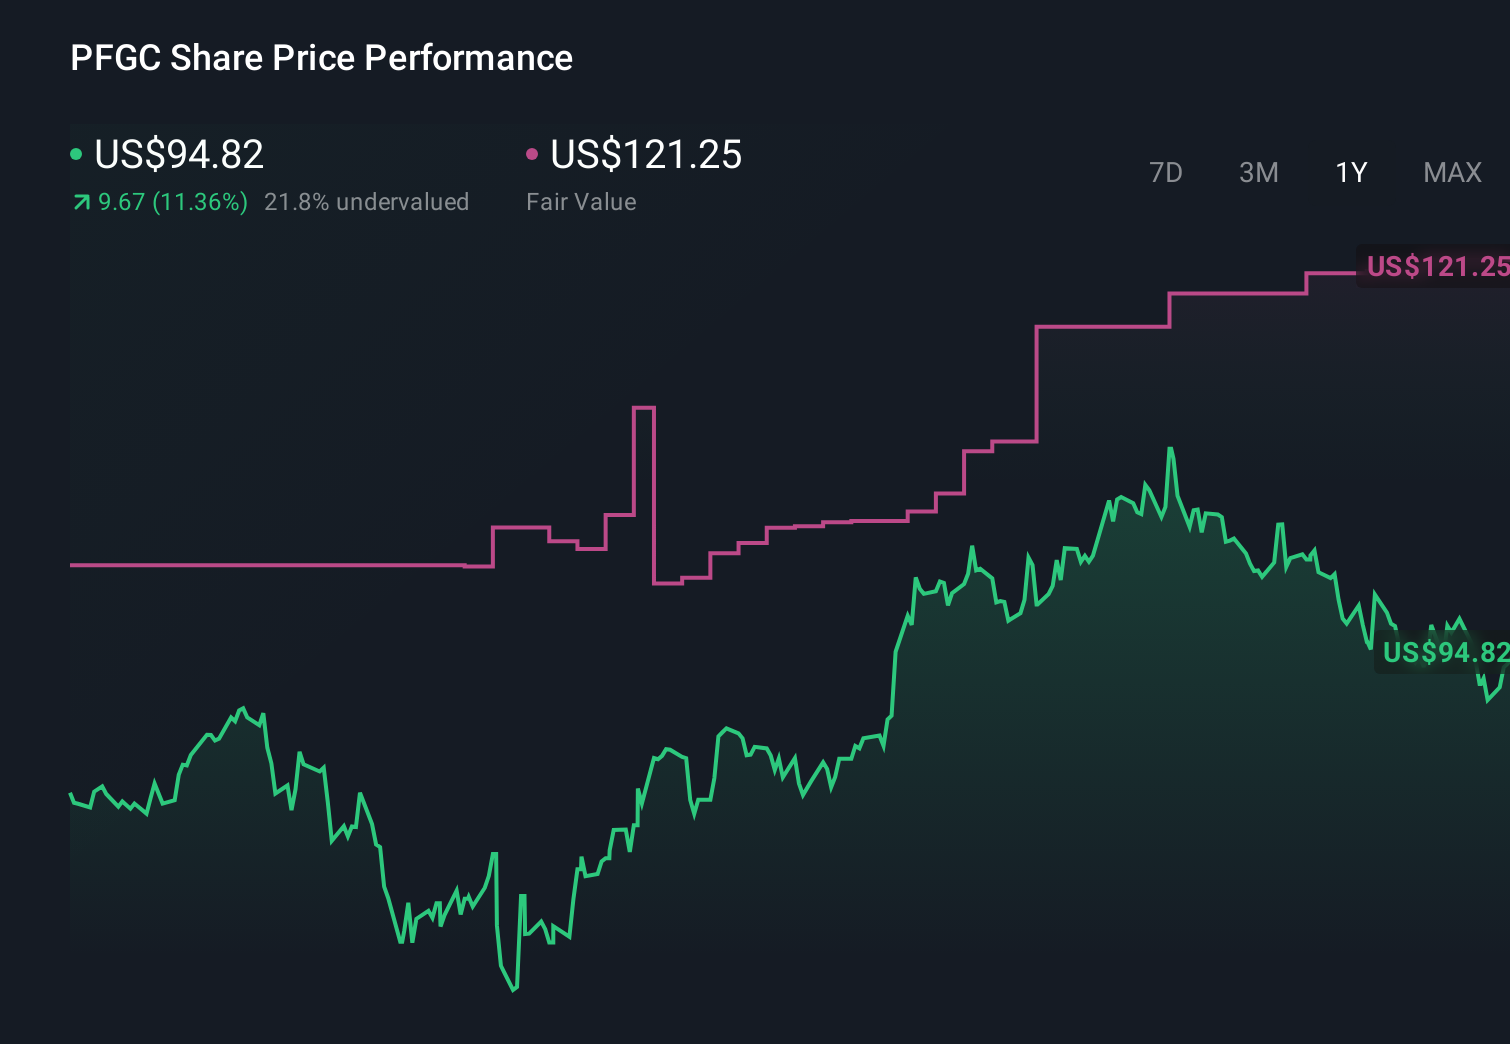
When those discounted cash flows are combined, the model provides an estimated intrinsic value of about $188.94 per share, compared with a recent share price of $97.43. Within this DCF framework, that difference is interpreted as the shares being 48.4% undervalued.
Result: UNDERVALUED (within this DCF model)
Our Discounted Cash Flow (DCF) analysis suggests Performance Food Group is undervalued by 48.4%. Track this in your watchlist or portfolio, or discover 879 more undervalued stocks based on cash flows.

For a profitable company, the P/E ratio is a straightforward way to think about what you are paying for each dollar of earnings. It helps you compare the price of one business with another using a single, familiar yardstick.
What counts as a “normal” P/E depends a lot on what investors expect for future growth and how much risk they see in the company. Higher growth and lower perceived risk usually support a higher multiple, while slower growth or higher risk tend to point to a lower one.
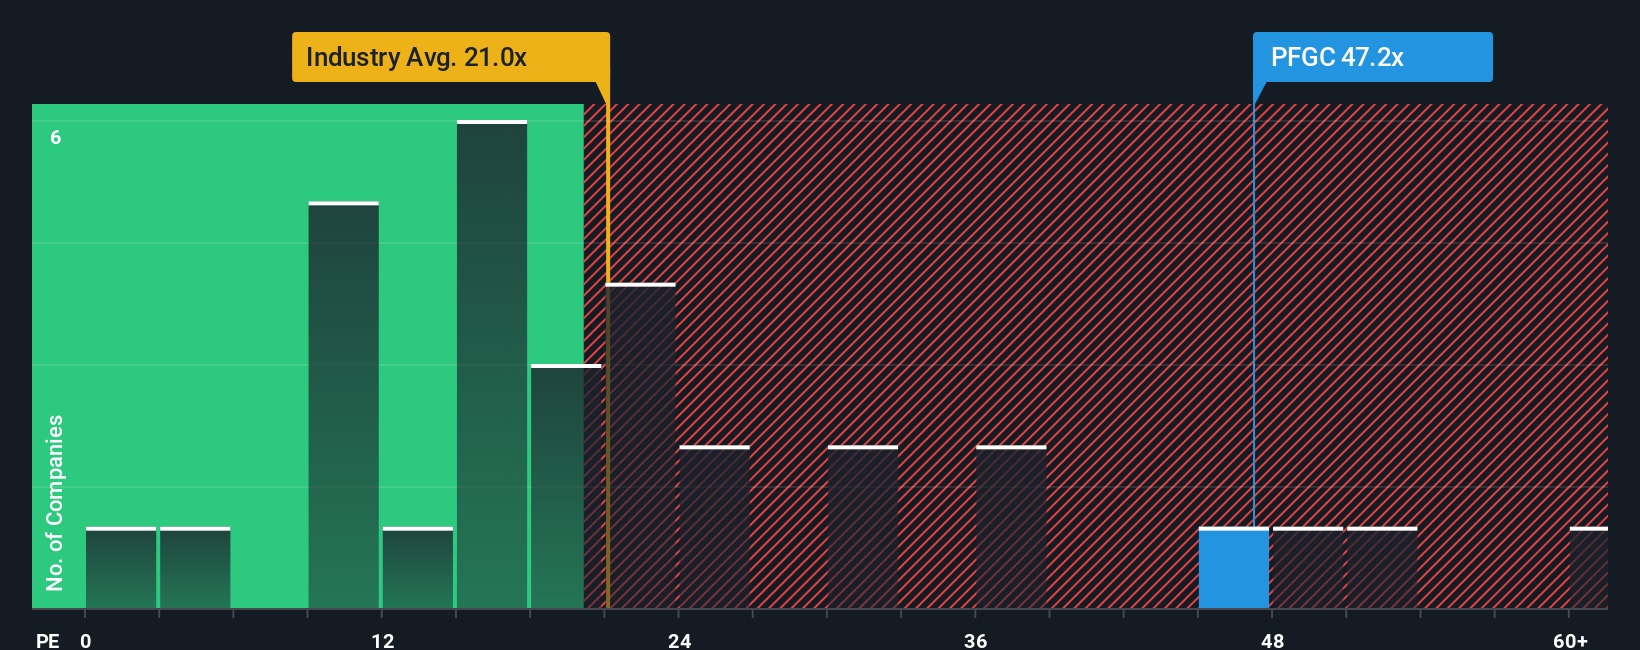
Performance Food Group currently trades on a P/E of 46.89x. That sits above the Consumer Retailing industry average of 21.75x and the peer group average of 29.60x. Simply Wall St’s Fair Ratio for the stock is 35.61x, which is a proprietary estimate of what the P/E might be based on factors such as earnings growth, profit margins, market cap, industry and specific risks.
Because the Fair Ratio pulls these company specific drivers together, it can be more informative than a simple comparison with peers or the broad industry. Here, the actual P/E of 46.89x is higher than the Fair Ratio of 35.61x, which points to the shares looking expensive on this measure.
Result: OVERVALUED
P/E ratios tell one story, but what if the real opportunity lies elsewhere? Discover 1425 companies where insiders are betting big on explosive growth.
Earlier we mentioned that there is an even better way to understand valuation, so let us introduce you to Narratives, which let you attach a clear story to your numbers by linking your view of a company to assumptions for future revenue, earnings, margins and an estimated fair value.
A Narrative on Simply Wall St is your personal view of how a business like Performance Food Group might develop, connected directly to a financial forecast and then to a fair value that you can compare with today’s share price to decide whether you see the stock as attractive, fully priced or less appealing.
You can build and explore Narratives on the Simply Wall St Community page, where millions of investors use the same simple tool, and each Narrative automatically refreshes when new information such as earnings releases or major news is added to the platform.
For example, one Performance Food Group Narrative might assume a relatively low fair value with moderate revenue growth and tight margins, while another could apply a materially higher fair value with stronger revenue expansion and improved margins based on a different view of the company’s opportunities and risks.
Do you think there's more to the story for Performance Food Group? Head over to our Community to see what others are saying!
This article by Simply Wall St is general in nature. We provide commentary based on historical data and analyst forecasts only using an unbiased methodology and our articles are not intended to be financial advice. It does not constitute a recommendation to buy or sell any stock, and does not take account of your objectives, or your financial situation. We aim to bring you long-term focused analysis driven by fundamental data. Note that our analysis may not factor in the latest price-sensitive company announcements or qualitative material. Simply Wall St has no position in any stocks mentioned.
