
يرجى استخدام متصفح الكمبيوتر الشخصي للوصول إلى التسجيل - تداول السعودية
حسنًا
Is Ryder System (R) Priced Fairly After Strong Multi Year Share Price Gains
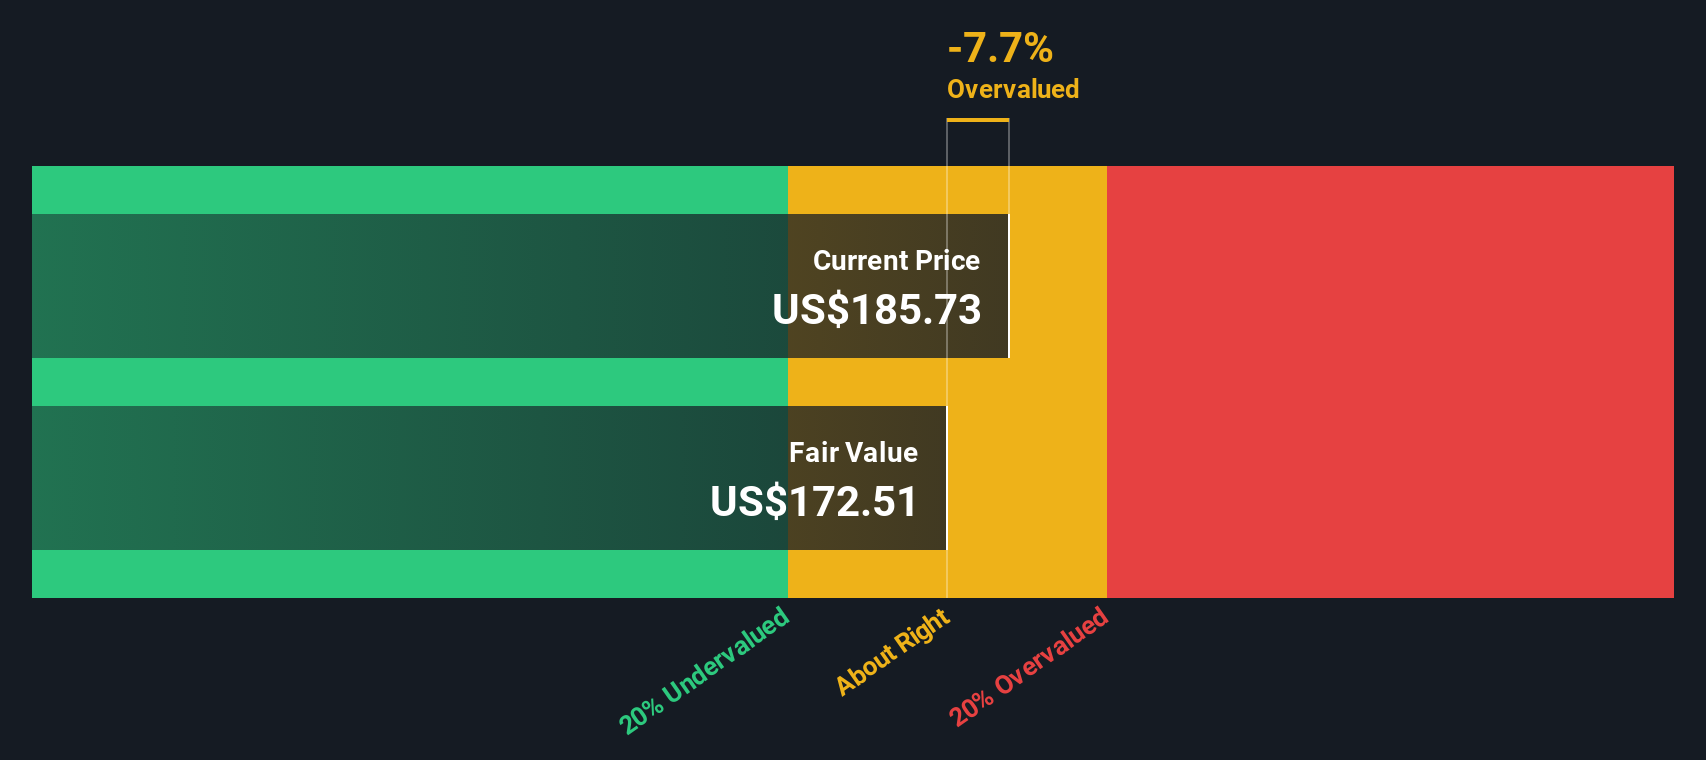
Ryder System, Inc. R | 192.47 | -0.52% |
A Discounted Cash Flow, or DCF, model takes the cash that a company is expected to generate in the future and then discounts those amounts back into today’s dollars to estimate what the business could be worth right now.
For Ryder System, the latest twelve month Free Cash Flow (FCF) is about $195.4 million. On Simply Wall St’s 2 Stage Free Cash Flow to Equity model, analyst inputs are used up to a certain point and then further annual FCF projections are extrapolated. In this model, projected FCF for 2026 is $898.3 million and the ten year path of cash flows is laid out, with each future year discounted back into today’s terms.
Adding those discounted cash flows together, the model arrives at an estimated intrinsic value of about $1,306.70 per share. Compared with the recent share price of $190.04, this output suggests that Ryder System may be trading at a substantial discount to this DCF-based intrinsic value estimate.
Result: UNDERVALUED
Our Discounted Cash Flow (DCF) analysis suggests Ryder System is undervalued by 85.5%. Track this in your watchlist or portfolio, or discover 877 more undervalued stocks based on cash flows.
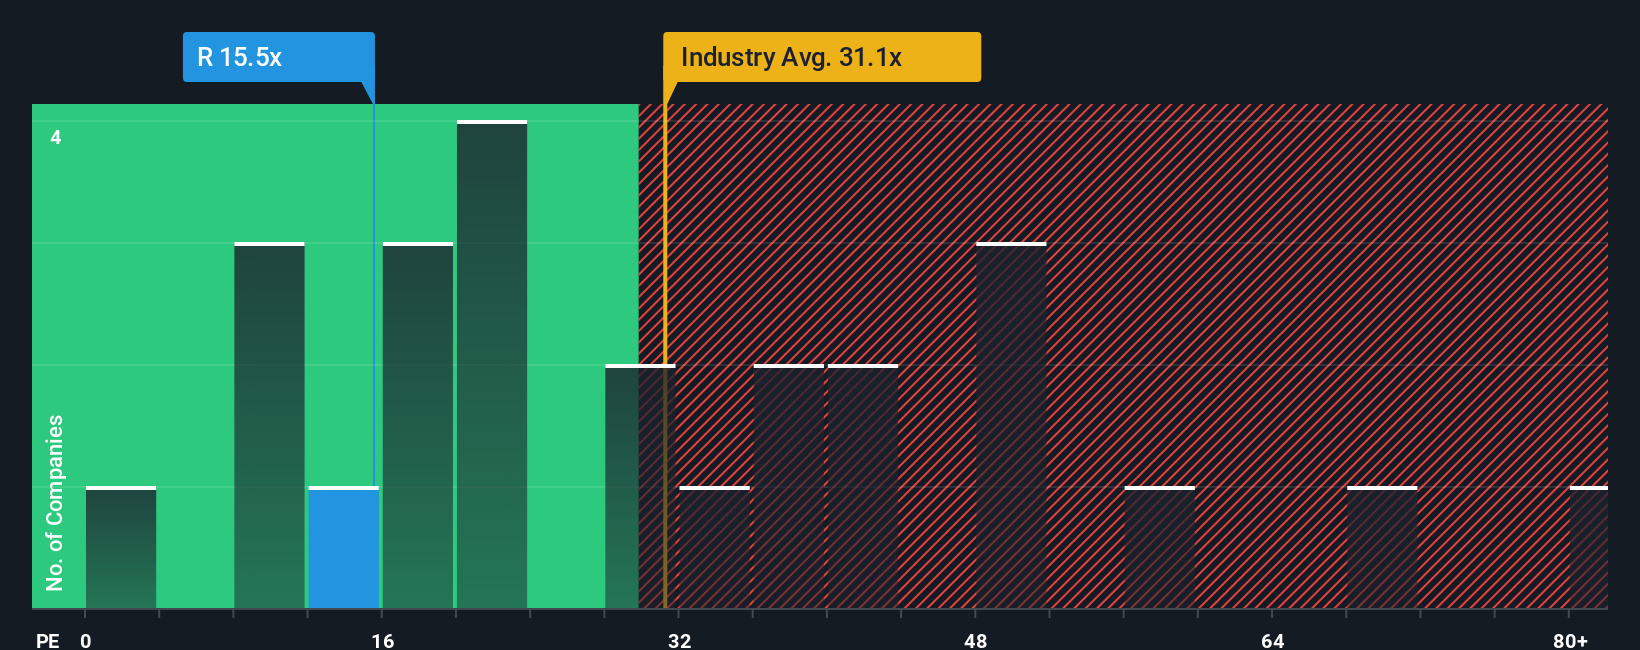
For a profitable company like Ryder System, the P/E ratio is a useful shortcut because it links what you pay per share to the earnings that business is already generating. Investors typically accept a higher P/E when they expect stronger growth or see lower risk, and look for a lower P/E when growth expectations are modest or risks feel higher.
Ryder System currently trades on a P/E of 15.35x. That sits below the Transportation industry average of 33.83x and the peer group average of 47.21x, which indicates the market is pricing its earnings more conservatively than many related companies.
Simply Wall St’s Fair Ratio for Ryder System is 15.14x. This is a proprietary estimate of what a reasonable P/E might be given factors such as the company’s earnings growth profile, profit margins, industry, market value and risk characteristics. Because it is tailored to the company, the Fair Ratio can be more informative than a simple comparison with industry or peer averages, which may not share the same fundamentals. With the current P/E of 15.35x sitting very close to the Fair Ratio of 15.14x, the market price appears broadly in line with this earnings based yardstick.
Result: ABOUT RIGHT
P/E ratios tell one story, but what if the real opportunity lies elsewhere? Discover 1445 companies where insiders are betting big on explosive growth.
Earlier we mentioned that there is an even better way to understand valuation. Let us introduce you to Narratives, which are simple stories you create about Ryder System that connect your view of its future revenue, earnings and margins to a financial forecast, a fair value and then a clear comparison with today’s share price. All of this happens within an accessible tool on Simply Wall St’s Community page that updates as new news or earnings arrive. You can then see, for example, how one investor might build a more optimistic Ryder Narrative around the higher US$215.0 analyst target while another leans on the lower US$183.0 target, and decide for yourself how the current price stacks up against the fair value you believe in.
Do you think there's more to the story for Ryder System? Head over to our Community to see what others are saying!

This article by Simply Wall St is general in nature. We provide commentary based on historical data and analyst forecasts only using an unbiased methodology and our articles are not intended to be financial advice. It does not constitute a recommendation to buy or sell any stock, and does not take account of your objectives, or your financial situation. We aim to bring you long-term focused analysis driven by fundamental data. Note that our analysis may not factor in the latest price-sensitive company announcements or qualitative material. Simply Wall St has no position in any stocks mentioned.
