Knight Swift Transportation Holdings Q4 Loss Tests Bullish Earnings Growth Narratives
Knight-Swift Transportation KNX | 0.00 |
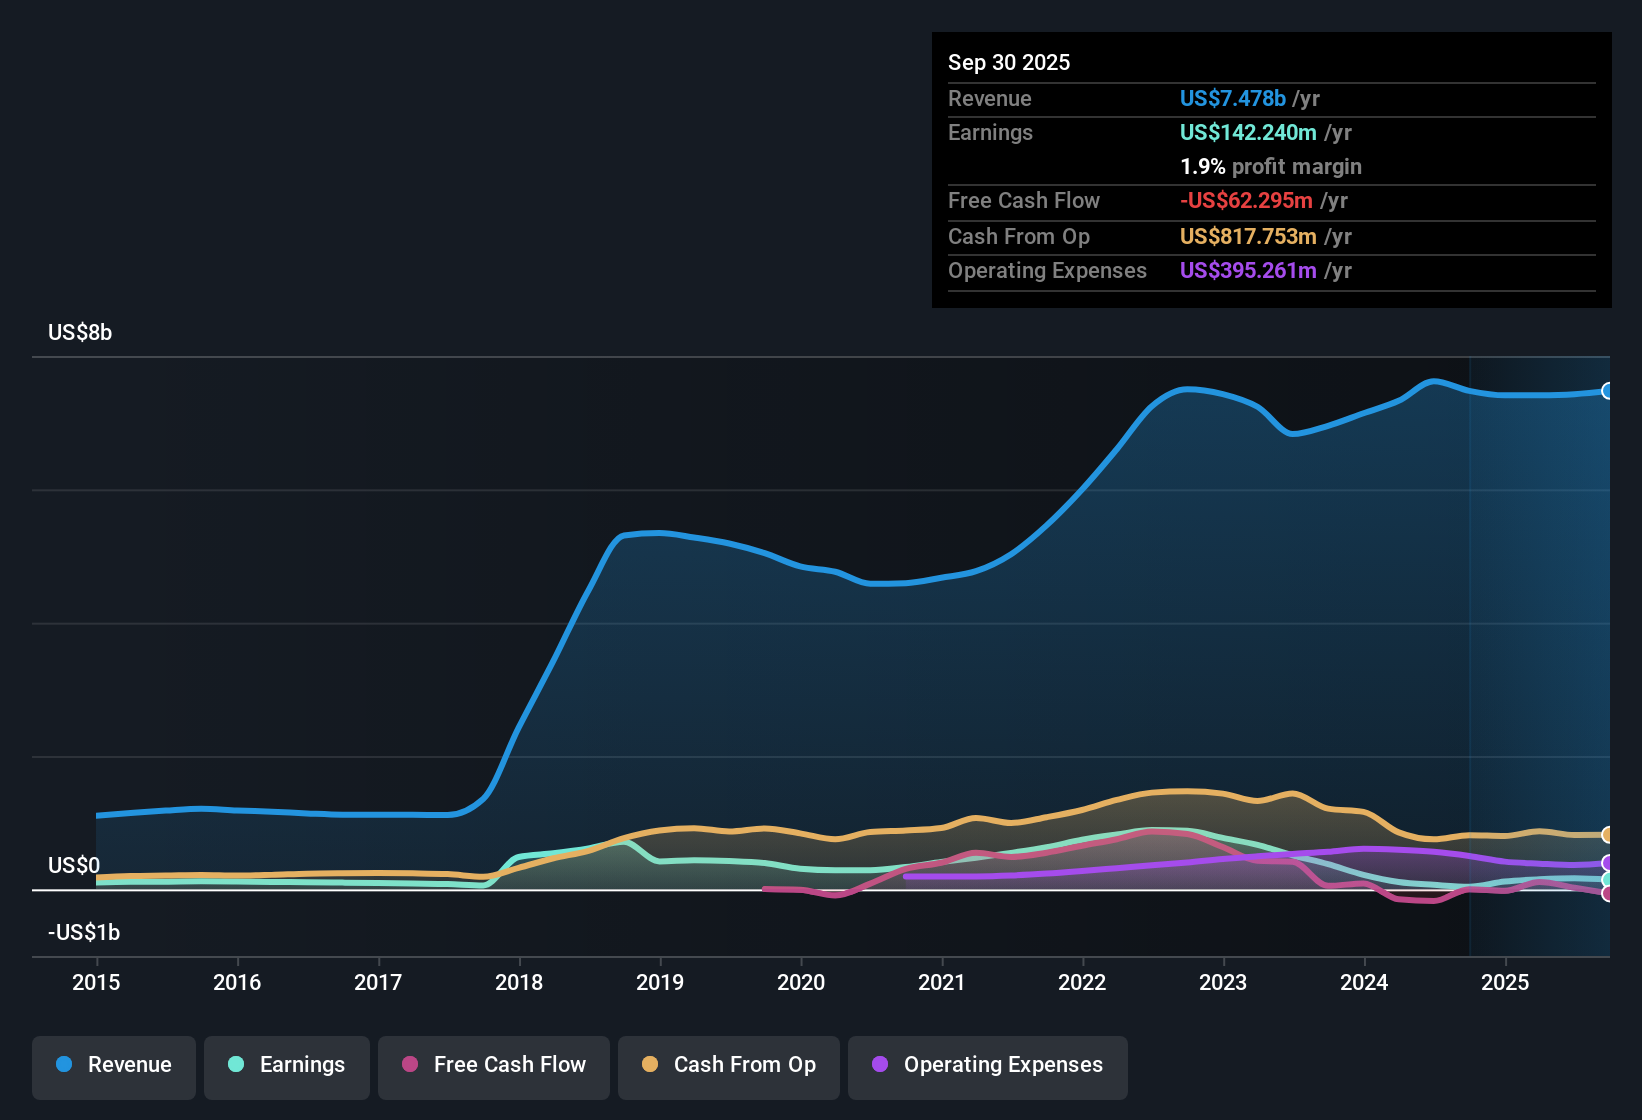
Knight-Swift Transportation Holdings (KNX) FY 2025 Earnings Snapshot
Knight-Swift Transportation Holdings (KNX) has just reported its FY 2025 numbers with fourth quarter revenue of US$1.9 billion, basic EPS of a US$0.04 loss and net income excluding extra items of a US$6.8 million loss, against a trailing twelve month picture of US$7.5 billion in revenue, basic EPS of US$0.41 and net income of US$65.9 million. Over the past few quarters, the company has seen revenue move in a tight range between US$1.8 billion and US$1.9 billion, while quarterly basic EPS has swung from US$0.21 and US$0.19 earlier in 2025 to a loss in the latest quarter. With net margin on a trailing basis at 0.9% versus 1.6% a year ago and results influenced by a US$102.6 million one-off loss, investors are likely to focus on how quickly margins can stabilize or rebuild.
See our full analysis for Knight-Swift Transportation Holdings.With the headline numbers in place, the next step is to see how this earnings print lines up with the prevailing narratives around Knight-Swift's growth potential, profit trajectory and risk profile.
Margins Under Pressure At 0.9% Net
- On a trailing basis, Knight-Swift generated about US$7.5b of revenue and US$65.9 million of net income excluding extra items, which works out to a 0.9% net margin compared with 1.6% a year earlier.
- Bears argue that low profitability leaves little room for error, and the numbers highlight that tension clearly:
- Across the last six quarters of trailing data, net income excluding extra items moved from US$117.6 million in 2024 Q4 to US$65.9 million most recently, while revenue stayed close to US$7.4b, so more revenue is not currently translating into stronger margins.
- The latest quarter shows a net income excluding extra items loss of US$6.8 million on US$1.9b of revenue, which aligns with the bearish concern that earnings can flip to a loss even when revenue is broadly steady.
US$102.6 Million One Off Distorts EPS
- Trailing basic EPS is US$0.41, compared with US$0.73 in the 2024 Q4 trailing period, and management has flagged that a US$102.6 million one off loss is included in the last twelve months, which has pulled reported profitability down.
- What is notable for the more bullish view is how much of the recent EPS softness is tied to that adjustment rather than the core run rate:
- Across FY 2025, quarterly basic EPS ranged from US$0.19 and US$0.21 in Q1 and Q2 to a US$0.04 loss in Q4, so underlying quarters earlier in the year were solidly positive before the one off flowed through to the trailing figures.
- Earnings are forecast to grow about 41.6% per year over the next three years while revenue is forecast to rise around 6% per year. This supports the bullish argument that current EPS and margin levels may not represent a ceiling if the one off does not repeat.
High 146.3x P/E Versus DCF Fair Value
- The shares trade at US$59.44, with a trailing P/E of 146.3x versus peer and industry averages of 29.3x and 33.7x, while a DCF fair value of US$134.81 suggests the stock is about 55.9% below that modelled value.
- For investors, that mix of numbers creates a clear push and pull between bullish optimism and bearish caution:
- On the bullish side, the gap between the US$59.44 share price and the US$134.81 DCF fair value is large, and is supported by the 41.6% forecast earnings growth rate if those forecasts are met.
- On the bearish side, the very high 146.3x trailing P/E, combined with the 0.9% net margin and the US$6.8 million latest quarter loss, shows that today’s valuation multiples are resting on low current earnings, which is exactly what critics focus on when they question how much of that DCF upside is realistic.
Next Steps
Don't just look at this quarter; the real story is in the long-term trend. We've done an in-depth analysis on Knight-Swift Transportation Holdings's growth and its valuation to see if today's price is a bargain. Add the company to your watchlist or portfolio now so you don't miss the next big move.
Explore Alternatives
Knight-Swift is working with thin 0.9% net margins, a recent quarterly loss and a very high 146.3x P/E based on modest trailing earnings.
If you want ideas where pricing lines up more tightly with current fundamentals and cash flows, check out these 878 undervalued stocks based on cash flows to zero in on companies that screen as better value right now.
This article by Simply Wall St is general in nature. We provide commentary based on historical data and analyst forecasts only using an unbiased methodology and our articles are not intended to be financial advice. It does not constitute a recommendation to buy or sell any stock, and does not take account of your objectives, or your financial situation. We aim to bring you long-term focused analysis driven by fundamental data. Note that our analysis may not factor in the latest price-sensitive company announcements or qualitative material. Simply Wall St has no position in any stocks mentioned.