
يرجى استخدام متصفح الكمبيوتر الشخصي للوصول إلى التسجيل - تداول السعودية
حسنًا
Lennox International (LII) Margin Improvement Reinforces Quality Narratives Despite Slower Growth Forecasts
Lennox International Inc. LII | 561.01 | +1.94% |
Lennox International (LII) has put another solid quarter on the board for FY 2025, with Q3 revenue of US$1.4 billion, basic EPS of US$7.00 and net income of US$245.8 million setting the tone for this earnings season update. The company has seen quarterly revenue move from US$1.5 billion in Q2 2025 to US$1.4 billion in Q3, while EPS has shifted from US$7.86 to US$7.00 over the same stretch. This gives investors a clean read on how the top and bottom line are tracking through the year. With margins running alongside these headline figures, the focus now is on how sustainable this profitability profile looks as new results roll through.
See our full analysis for Lennox International.With the numbers on the table, the next step is to line them up against the prevailing narratives around Lennox to see which views the latest margins and earnings support and which ones they start to challenge.
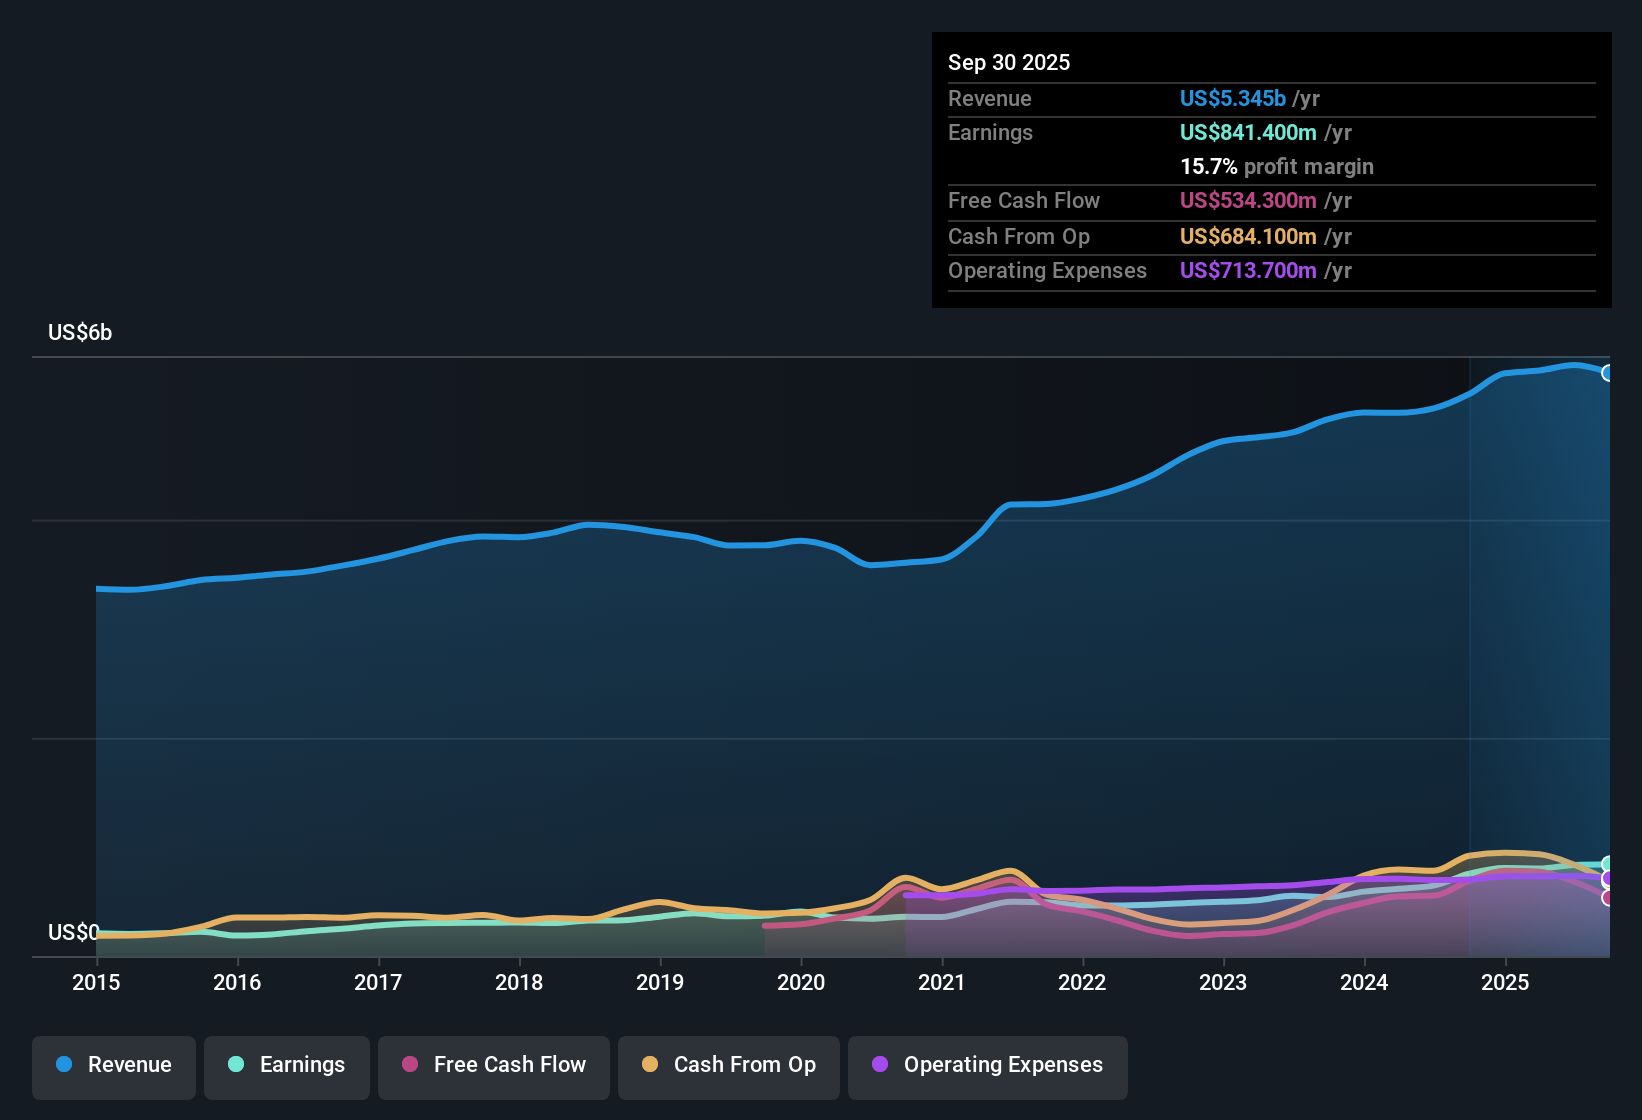
Investors who focus on quality of earnings rather than sheer size tend to pay attention when net margin edges higher while revenue growth stays modest.
For you as an investor, that gap versus market growth expectations is a key piece of context when you think about how ambitious future assumptions should be.
Putting those pieces together helps you see why some investors see a fairly priced quality business, while others focus more on slower forecast growth and leverage when weighing up the trade off.
To see how other investors are pulling these threads together, including how they weigh growth, debt and valuation, Curious how numbers become stories that shape markets? Explore Community Narratives
Don't just look at this quarter; the real story is in the long-term trend. We've done an in-depth analysis on Lennox International's growth and its valuation to see if today's price is a bargain. Add the company to your watchlist or portfolio now so you don't miss the next big move.
Lennox pairs healthy margins with slower forecast growth than the broader US market and carries a high level of debt alongside its current earnings base.
If that mix of slower growth and higher leverage feels uncomfortable, use our solid balance sheet and fundamentals stocks screener (386 results) to zero in on companies with sturdier finances and more room to move.
This article by Simply Wall St is general in nature. We provide commentary based on historical data and analyst forecasts only using an unbiased methodology and our articles are not intended to be financial advice. It does not constitute a recommendation to buy or sell any stock, and does not take account of your objectives, or your financial situation. We aim to bring you long-term focused analysis driven by fundamental data. Note that our analysis may not factor in the latest price-sensitive company announcements or qualitative material. Simply Wall St has no position in any stocks mentioned.
