Malibu Boats (MBUU) Q2 EPS Loss Tests Bullish Earnings Recovery Narrative
Malibu Boats, Inc. Class A MBUU | 0.00 |
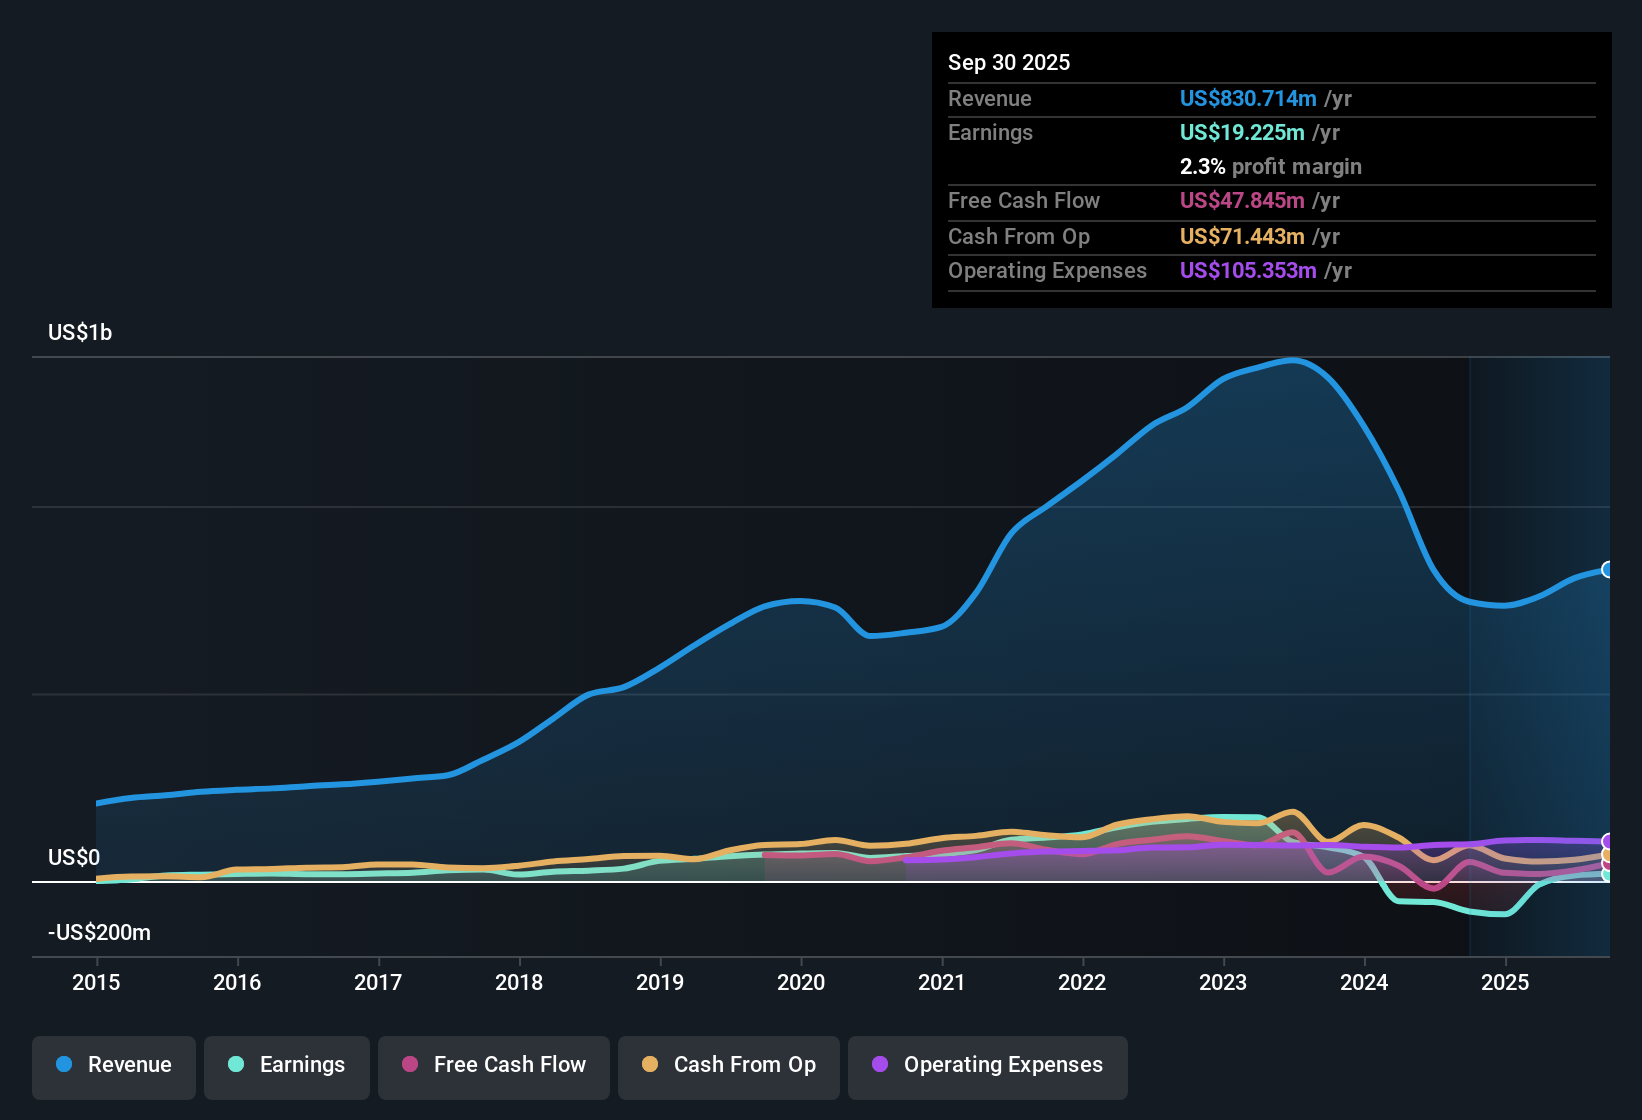
Malibu Boats (MBUU) has just posted Q2 2026 results with revenue of US$188.6 million and a basic EPS loss of US$0.13, alongside net income excluding extra items of a US$2.5 million loss, setting a cautious tone for the quarter. Over recent quarters the company has seen revenue move between US$171.6 million and US$228.7 million, with EPS ranging from a loss of US$0.25 to a profit of US$0.66. Trailing twelve month EPS sits at US$0.74 on net income of US$14.4 million, which puts the focus squarely on how margins are holding up through the latest soft patch.
See our full analysis for Malibu Boats.With the headline numbers on the table, the next step is to see how they line up with the widely followed narratives around Malibu Boats, where the market is weighing earnings recovery potential against the quality and durability of those margins.
Trailing EPS Positive, But Recent Losses Persist
- Over the last twelve months Malibu Boats earned basic EPS of US$0.74 on US$819.1 million of revenue, even though the last two quarters on their own show basic EPS losses of US$0.13 in Q2 2026 and US$0.04 in Q1 2026.
- What stands out against a more bullish angle is that analysts expect earnings to grow about 30.4% per year after the company has only recently returned to profitability, yet the five year history shows earnings declining at 36.1% per year. This means:
- The trailing net income of US$14.4 million confirms the business is currently profitable, but that sits beside a much weaker multiyear track record.
- Short term losses in Q1 and Q2 2026 contrast with the positive last twelve month EPS, so anyone leaning bullish has to reconcile strong growth forecasts with near term pressure on profitability.
Revenue Holds Around US$188 million To US$229 million Band
- Quarterly revenue over the last six reported periods has stayed within a relatively tight range between US$171.6 million and US$228.7 million, with Q2 2026 revenue at US$188.6 million compared with US$194.7 million in Q1 2026 and US$228.7 million in Q3 2025.
- Bears point to the forecast revenue growth of about 3.6% per year, which sits below the US market forecast of 10.3% per year, and the recent revenue pattern supports that caution because:
- The last twelve month revenue of US$819.1 million is close to the prior trailing figures in the data, suggesting only modest top line momentum compared with broader market expectations.
- With revenue moving within a US$171.6 million to US$228.7 million band across the last six quarters, critics focus on whether slower sales growth can support the much stronger forecast for EPS growth.
Rich P/E And DCF Gap Keep Valuation In Focus
- The shares trade on a trailing P/E of 30.7x at a current price of US$31.24, above the North American Leisure industry average of 26.8x, while the provided DCF fair value is US$31.43 and a separate DCF based estimate in the data is US$20.80, both below or around where the stock currently trades.
- What challenges a bullish stance is how this high multiple lines up with the mixed earnings record, because:
- The stock price of US$31.24 is close to the DCF fair value of US$31.43 but above the US$20.80 DCF based value, which encourages investors to scrutinize whether the forecast 30.4% annual earnings growth is enough to justify paying more than the industry P/E.
- Five year earnings declines of 36.1% per year sit awkwardly beside the premium P/E and the DCF gap, so anyone optimistic on the name has to be comfortable that the recent return to profitability is not just a temporary improvement.
Next Steps
Don't just look at this quarter; the real story is in the long-term trend. We've done an in-depth analysis on Malibu Boats's growth and its valuation to see if today's price is a bargain. Add the company to your watchlist or portfolio now so you don't miss the next big move.
See What Else Is Out There
Malibu Boats combines recent quarterly losses, a mixed multiyear earnings record and a premium P/E, which raises questions about paying up for inconsistent profitability.
If that mix of patchy earnings and a rich valuation makes you uneasy, it is worth checking our 53 high quality undervalued stocks to find companies where pricing looks more grounded in current fundamentals.
This article by Simply Wall St is general in nature. We provide commentary based on historical data and analyst forecasts only using an unbiased methodology and our articles are not intended to be financial advice. It does not constitute a recommendation to buy or sell any stock, and does not take account of your objectives, or your financial situation. We aim to bring you long-term focused analysis driven by fundamental data. Note that our analysis may not factor in the latest price-sensitive company announcements or qualitative material. Simply Wall St has no position in any stocks mentioned.