Latest Quarter Sets The Stage For Mercury Systems' Earning Story
Mercury Systems (MRCY) has just posted Q2 2026 results with revenue of US$232.9 million and a basic EPS loss of US$0.25, as net income excluding extra items came in at a loss of US$15.1 million. The company has seen quarterly revenue move from US$223.1 million in Q2 2025 to US$232.9 million in Q2 2026, while basic EPS shifted from a loss of US$0.30 to a loss of US$0.25 over the same period, setting up a picture where top line scale contrasts with ongoing pressure on margins.
See our full analysis for Mercury Systems.
With the headline numbers on the table, the next step is to see how this earnings print lines up against the widely followed narratives around Mercury Systems’ growth, profitability path, and long term potential.
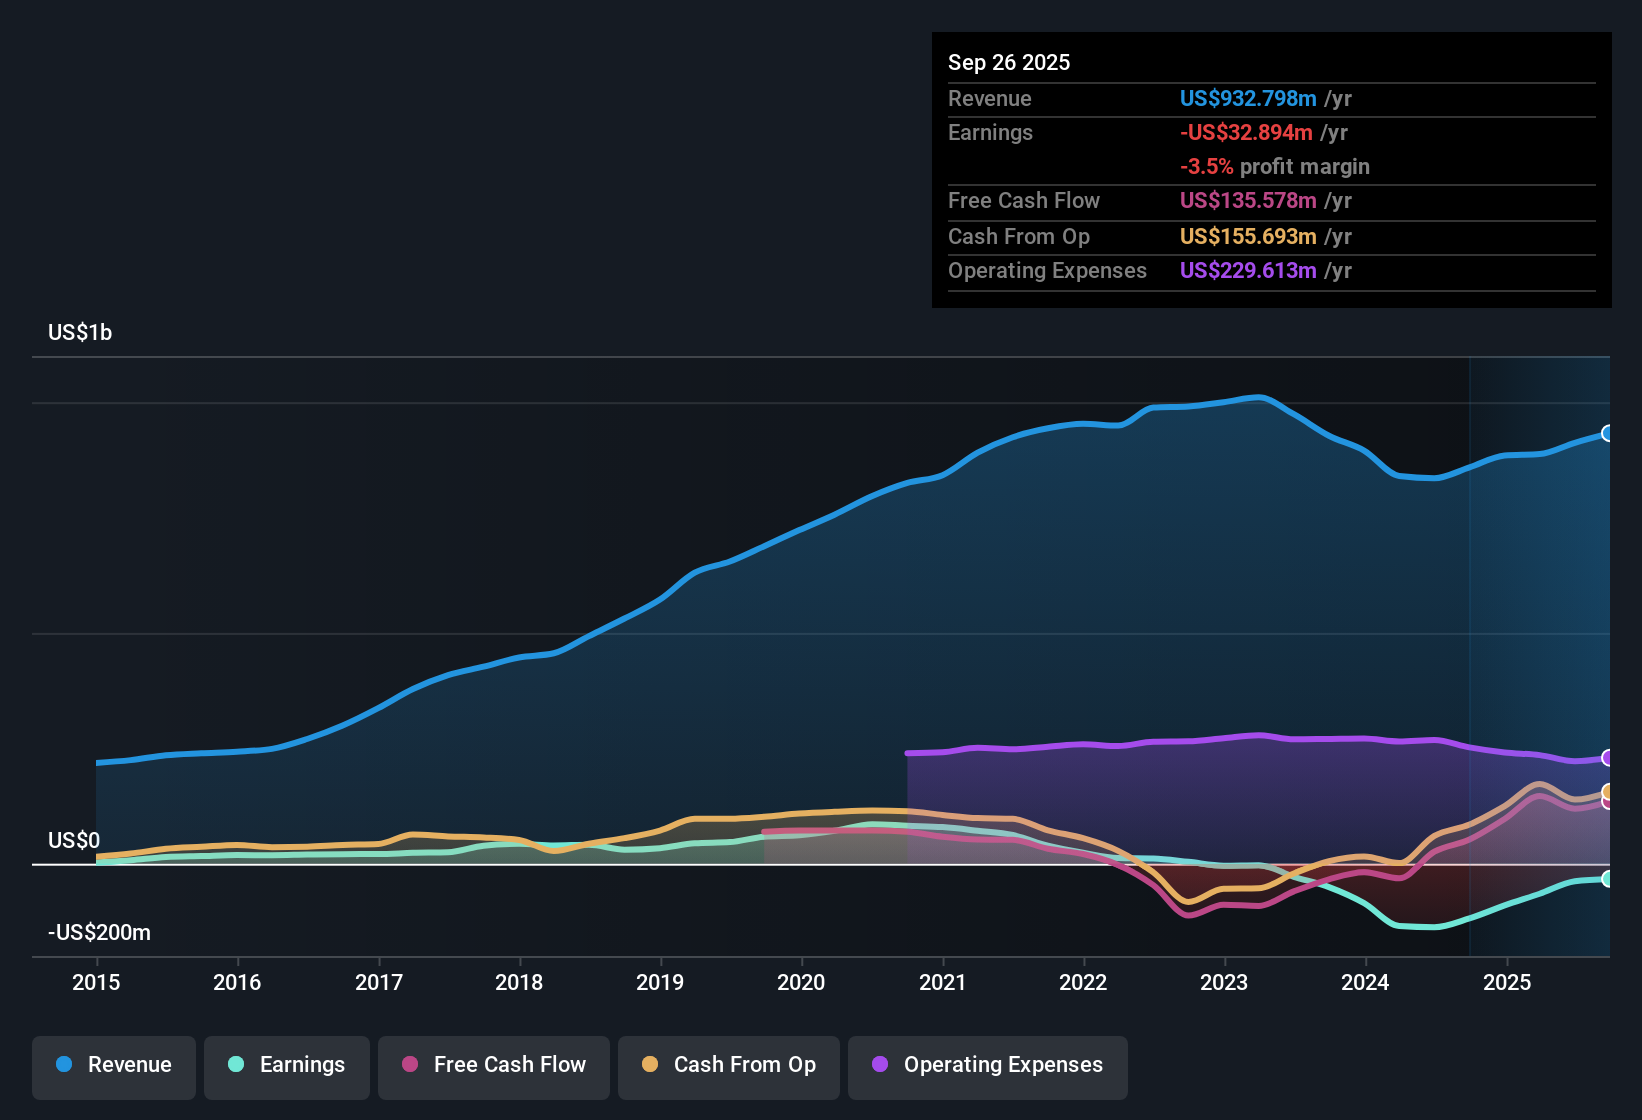
NasdaqGS:MRCY Earnings & Revenue History as at Feb 2026
Losses Persist Despite US$942.5m In Trailing Revenue
Over the last twelve months, Mercury Systems generated US$942.5 million of revenue but recorded a net loss of US$30.4 million and basic EPS of a US$0.51 loss.
Critics highlight that the business is still unprofitable after several years, and the trailing loss of US$30.4 million against US$942.5 million of revenue supports that concern, while:
Multi year losses grew at about 59.7% per year, which lines up with the view that the earnings track record is under pressure.
Trailing revenue growth of 7.9% per year is also below the 10.1% US market benchmark, so bears point to slower top line progress alongside ongoing losses.
Revenue Growth Of 7.9% Sits Below Market Benchmark
The dataset shows trailing revenue growth of 7.9% per year compared with a 10.1% benchmark for the broader US market, so Mercury Systems is growing but at a slower pace than that reference point.
Supporters of a more optimistic view argue that even with slower revenue growth, the earnings picture can still shift meaningfully, which the data partially backs and challenges at the same time, because:
Forecasts point to a very large 104.79% annual earnings growth rate and an expectation that the company becomes profitable within three years.
At the same time, the latest quarterly figures still show a loss of US$15.1 million on US$232.9 million of revenue, so the bullish story depends on a significant change from how the business has recently been performing.
To see how these numbers fit into the bigger story on growth, profitability and valuation, check out the full narrative investors are building around Mercury Systems.
📊 Read the full Mercury Systems Consensus Narrative.
Mixed Valuation Signals With P/S At 4.9x
The stock trades on a P/S of 4.9x, which sits above the US Aerospace & Defense industry average of 3.7x but below a peer group average of 13.5x, and compares to a DCF fair value of US$68.68 versus a current share price of US$79.07.
What stands out for valuation focused investors is the tension between upside hopes and current pricing, because:
The market price is higher than the DCF fair value cited here, so anyone leaning on that model might see less room for upside even with strong earnings forecasts.
Yet the P/S being lower than the peer average is often pointed to as a relative support for the shares, especially when combined with the expected move to profitability within three years.
Next Steps
Don't just look at this quarter; the real story is in the long-term trend. We've done an in-depth analysis on Mercury Systems's growth and its valuation to see if today's price is a bargain. Add the company to your watchlist or portfolio now so you don't miss the next big move.
See What Else Is Out There
Mercury Systems is still loss making on US$942.5 million of trailing revenue, with revenue growth below the 10.1% US market benchmark and earnings under pressure.
If that mix of slower growth and ongoing losses gives you pause, use stable growth stocks screener (2176 results) to focus on companies that already pair consistent revenue progress with steadier earnings profiles.
This article by Simply Wall St is general in nature. We provide commentary based on historical data and analyst forecasts only using an unbiased methodology and our articles are not intended to be financial advice. It does not constitute a recommendation to buy or sell any stock, and does not take account of your objectives, or your financial situation. We aim to bring you long-term focused analysis driven by fundamental data. Note that our analysis may not factor in the latest price-sensitive company announcements or qualitative material. Simply Wall St has no position in any stocks mentioned.