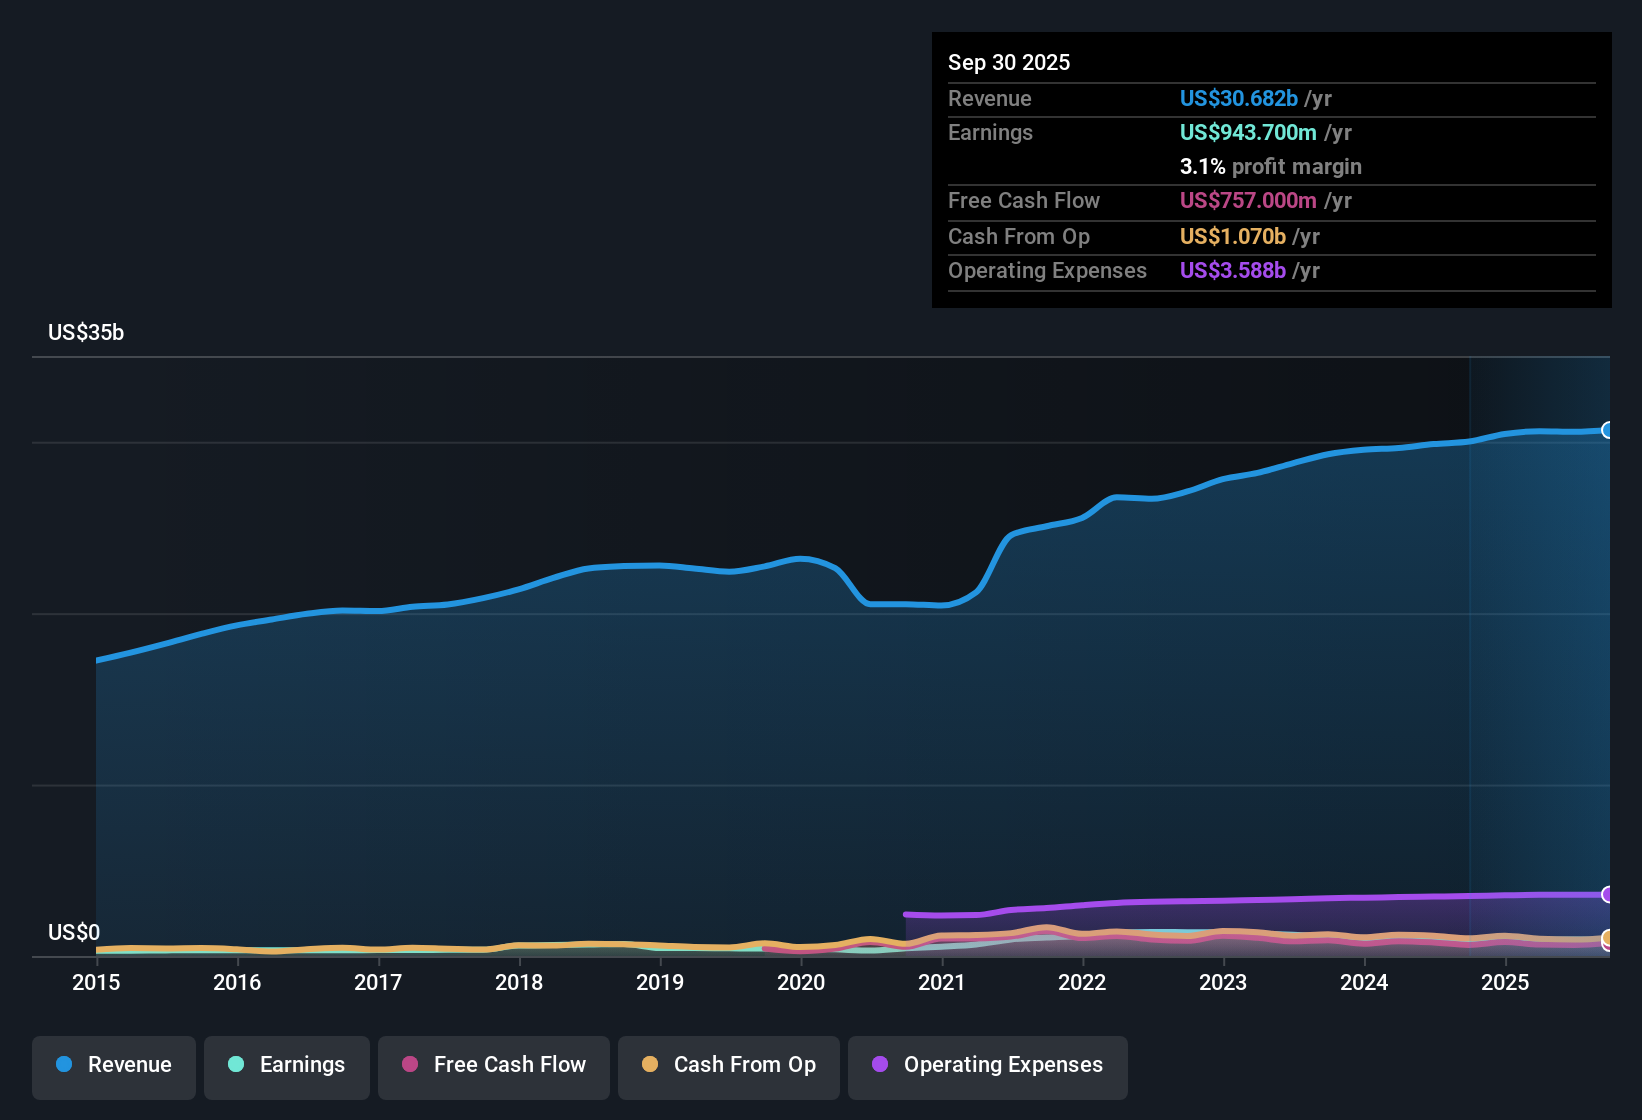
Penske Automotive Group (PAG) just posted third quarter FY 2025 results with revenue of about US$7.7b and basic EPS of US$3.23, alongside net income of US$213m. Trailing 12 month EPS sits at US$14.20 on revenue of roughly US$30.7b and net income of US$943.7m. Over recent quarters the company has seen revenue move in a tight band from US$7.6b to US$7.7b, with quarterly basic EPS ranging between US$3.23 and US$3.78. This sets up a picture where modest earnings growth and a 3.1% net margin put the focus firmly on how efficiently the business is converting sales into profit.
See our full analysis for Penske Automotive Group.
With the headline numbers on the table, the next step is to see how this margin profile lines up with the widely held narratives around Penske Automotive Group and where the latest results challenge those views.
NYSE:PAG Earnings & Revenue History as at Feb 2026
3.1% net margin and what it says about quality
Penske’s net profit margin over the last 12 months sits at 3.1%, slightly above the 2.9% level cited a year earlier, while trailing 12 month EPS is US$14.20 on US$30.7b of revenue and US$943.7m of net income.
Consensus narrative highlights record growth in service and parts revenue and gross profit supporting margins, and this margin profile lines up with that story. Bears point out that profit margins are expected to ease toward about 2.6% to 2.7% over the next few years, so today’s 3.1% leaves some room for that compression without immediately contradicting either side’s expectations.
Supporters of the bullish view point to higher margin, recurring service revenue as a key earnings driver, which is consistent with a 3.1% margin and high reported earnings quality.
Skeptics focus on pressure from electric vehicles and direct sales on long term service income and dealership profits, which is why forecasts build in lower future margins even though the recent 2.9% to 3.1% step up looks supportive right now.
Valuation gap versus 12.1x P/E
The shares trade on a 12.1x trailing P/E, below the US Specialty Retail average of 20.4x and a touch under the peer average of 12.3x, while the current price of US$173.22 sits beneath both the DCF fair value of about US$183.17 and the allowed analyst price target reference of US$180.33.
What stands out for the bullish narrative is that recent 8.1% earnings growth and an 8.2% earnings growth forecast are paired with this lower P/E and a price below DCF fair value of US$183.17. The same data set includes forecasts for margins to edge down from 3.1% to around 2.6% to 2.7%, which means bulls are leaning on valuation support and resilience in service driven profits while accepting that headline profitability per dollar of sales may not stay at current levels.
Backers of the bullish view argue that international expansion, premium brands and digital retail can keep EPS around the current trailing US$14.20 level or better, which they see as attractive against the 12.1x P/E and DCF fair value of US$183.17.
At the same time, the expectation of lower margins in a few years shows that even bullish assumptions are not based on ever rising profitability, so the current valuation gap is doing part of the heavy lifting in that argument.
Have a look at how optimistic investors frame this setup, including the trade off between margin pressure and valuation support, in the full bull case for Penske.
🐂 Penske Automotive Group Bull Case
Debt coverage risk versus 8.1% earnings growth
Over the last year, earnings grew 8.1% while the trailing net margin improved to 3.1%, but the risk summary flags that debt is not well covered by operating cash flow and that the dividend record is unstable.
Bears argue that this combination of weaker debt coverage and an unstable dividend, together with forecast revenue growth of about 3.3% to 5.8% a year that trails the cited 10.4% US market benchmark, leaves the business more exposed if conditions turn. The recent 8.1% earnings growth and margin uptick are important positives but do not directly address the concern that servicing and reducing debt could be harder if cash flow growth slows from here.
Critics point out that acquisition driven growth and capital needs for EV and digital investments can add to leverage, which is why the risk summary singles out debt coverage as a major issue despite the 3.1% margin.
On the other hand, the same data set shows high earnings quality and a full year net income of about US$943.7m, which bear side readers may weigh against the debt coverage warning when judging how stretched the balance sheet might be.
If you want to see how cautious investors connect these balance sheet flags to future profit expectations, the detailed bear case
Next Steps
To see how these results tie into long-term growth, risks, and valuation, check out the full range of community narratives for Penske Automotive Group on Simply Wall St. Add the company to your watchlist or portfolio so you'll be alerted when the story evolves.
See the numbers differently? Take a couple of minutes to test your own angle against the data and shape a clear story for yourself. Do it your way
A great starting point for your Penske Automotive Group research is our analysis highlighting 4 key rewards and 2 important warning signs that could impact your investment decision.
See What Else Is Out There
Penske’s flagged weak debt coverage, unstable dividend record and concerns about how easily future cash flows might support obligations all point to balance sheet fragility.
If those red flags make you cautious, take a moment to line this up against companies filtered for stronger financial footing using our solid balance sheet and fundamentals stocks screener (45 results), so you can quickly compare Penske with businesses that appear better equipped to handle pressure.
This article by Simply Wall St is general in nature. We provide commentary based on historical data and analyst forecasts only using an unbiased methodology and our articles are not intended to be financial advice. It does not constitute a recommendation to buy or sell any stock, and does not take account of your objectives, or your financial situation. We aim to bring you long-term focused analysis driven by fundamental data. Note that our analysis may not factor in the latest price-sensitive company announcements or qualitative material. Simply Wall St has no position in any stocks mentioned.