خسارة شركة Sphere Entertainment (SPHR) في ربحية السهم تُعيد إثارة المخاوف بشأن الربحية على الرغم من روايات النمو.
Sphere Entertainment SPHR | 0.00 |
أعلنت شركة Sphere Entertainment (SPHR) مؤخرًا عن نتائجها المالية للربع الثالث من السنة المالية 2025، حيث بلغت الإيرادات 262.5 مليون دولار أمريكي، وخسارة أساسية في ربحية السهم قدرها 2.80 دولار أمريكي، إلى جانب خسارة صافية في الدخل قدرها 101.2 مليون دولار أمريكي، مما يُشير إلى حذر في توقعات الربحية. وخلال الأرباع الستة الماضية، تراوحت الإيرادات بين 227.9 مليون دولار أمريكي و321.3 مليون دولار أمريكي، بينما تراوحت خسارة ربحية السهم الأساسية بين 2.95 دولار أمريكي و4.18 دولار أمريكي، مما يُعطي المستثمرين صورة متباينة عن القدرة الربحية. ومع استمرار نتائج الاثني عشر شهرًا الماضية في الإشارة إلى خسائر كبيرة، يُركز التقرير الأخير بشكل أساسي على إمكانية تحسن هوامش الربح في نهاية المطاف، بدلاً من التركيز على النمو الإجمالي.
اطلع على تحليلنا الكامل لشركة Sphere Entertainment.وبعد انتهاء الربع الحالي، تتمثل الخطوة التالية في معرفة كيف تقارن هذه الأرقام مع الروايات الأكثر شيوعًا حول شركة Sphere Entertainment، وأي من هذه الروايات تصمد أمام التدقيق.
استمرار الخسائر رغم تحقيق إيرادات بلغت 1.1 مليار دولار أمريكي خلال الاثني عشر شهراً الماضية
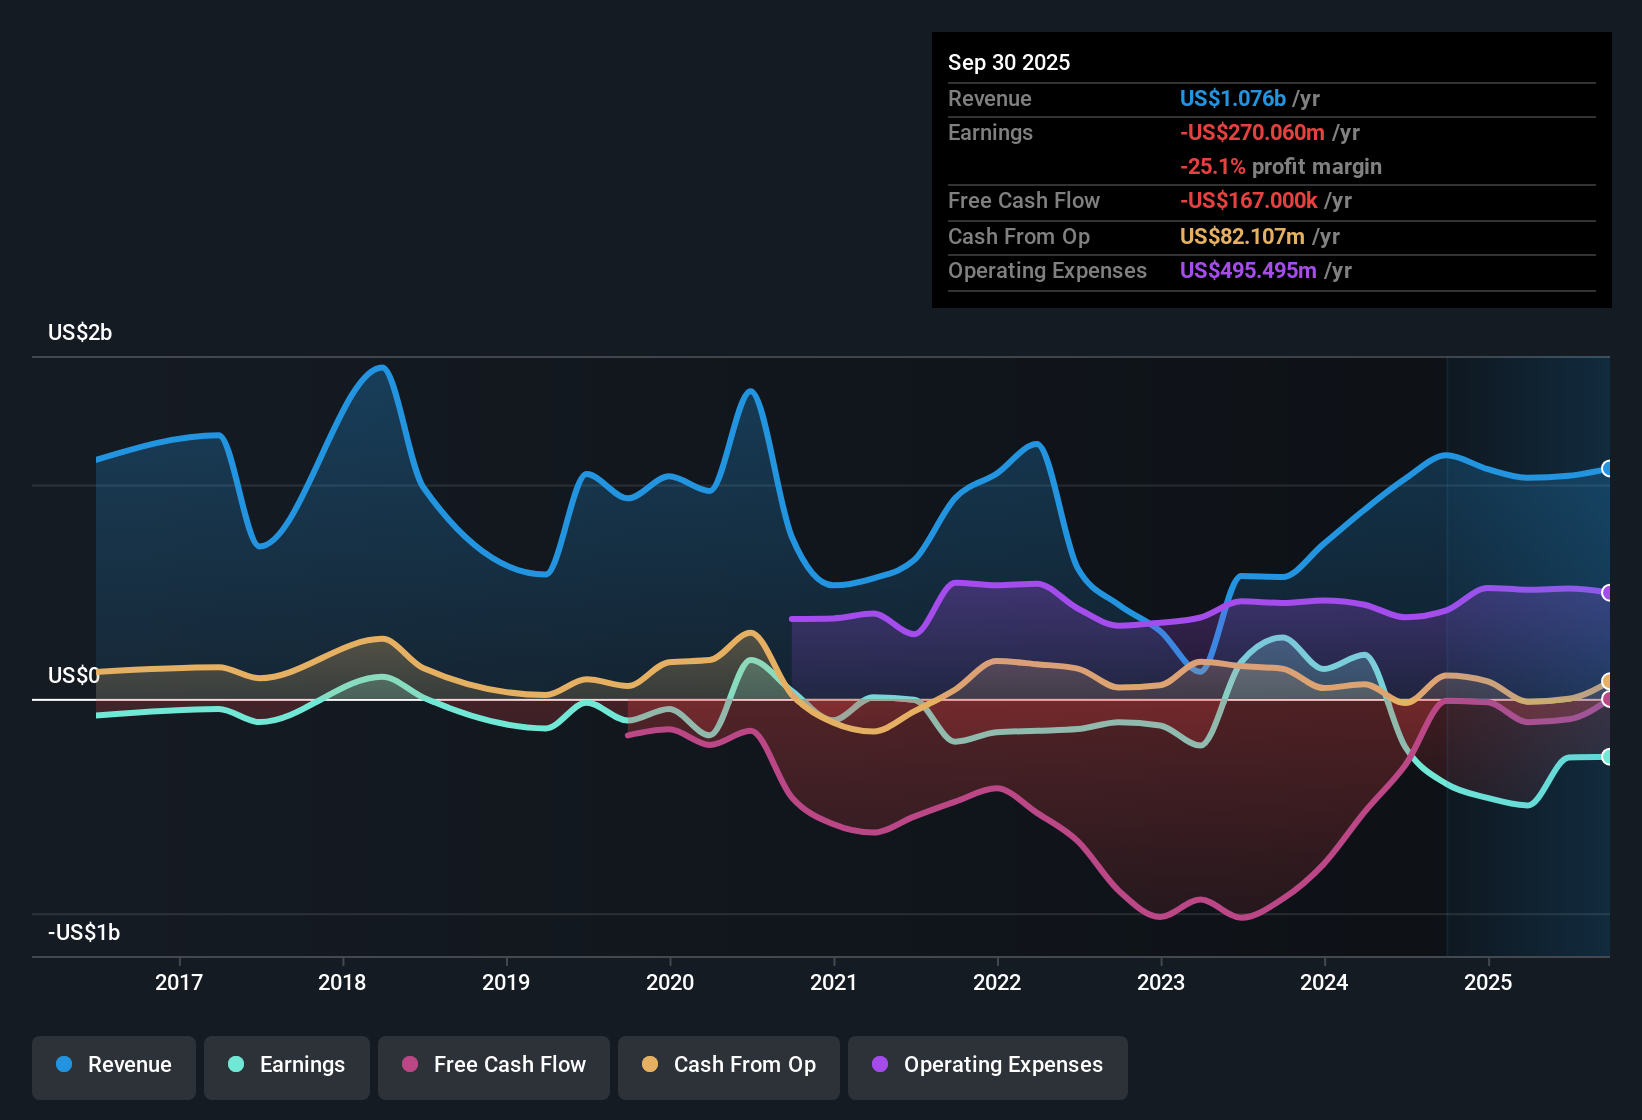
- على مدار الاثني عشر شهرًا الماضية، حققت شركة Sphere إيرادات بقيمة 1.1 مليار دولار أمريكي وسجلت خسارة صافية قدرها 270.1 مليون دولار أمريكي، مع خسارة أساسية في ربحية السهم قدرها 7.43 دولار أمريكي.
- تشير التوقعات السائدة إلى إمكانية تحقيق أرباح قابلة للتوسع وذات هوامش ربح أعلى بمرور الوقت من خلال القطاعات الدولية والتقنيات الخاصة. ومع ذلك، فإن الخسارة الحالية خلال الاثني عشر شهرًا الماضية والبالغة 270.1 مليون دولار أمريكي، بالإضافة إلى اتجاه الخسائر المتفاقمة على مدى خمس سنوات بنسبة 24.6% سنويًا، تُظهر أن الضغط على هوامش الربح لا يزال قائمًا بقوة.
- يتوقع المحللون نموًا في الإيرادات بنحو 6.5% سنويًا وفقًا لتوقعاتهم. في المقابل، تشير التوقعات المنفصلة الواردة في ملخص المخاطر إلى انخفاض طفيف في الإيرادات بنسبة 0.08% سنويًا، لذا قد يختلف مسار نمو الإيرادات الذي يعتمده المستثمرون عما تشير إليه البيانات السابقة.
- تتناقض فكرة هوامش الربح المستقبلية على مستوى القطاع، والتي تبلغ 9.4%، مع الوضع الحالي الذي يشهد خسائر، حيث لا تُظهر أي من بيانات هوامش الربح السابقة أي نتائج إيجابية. ونتيجة لذلك، لا تُشابه الأرقام الحالية نموذج القطاع الذي بُنيت عليه الرؤية السائدة.
نظام توجيه معزز متعدد ممتاز مع إشارة DCF علوية
- يتم تداول أسهم شركة Sphere بنسبة سعر إلى مبيعات تبلغ 3.8 ضعف، مقارنةً بمتوسط 2.2 ضعف للشركات المماثلة، ومتوسط 1.5 ضعف لقطاع الترفيه الأمريكي. ويبلغ سعر السهم الحالي 115.72 دولارًا أمريكيًا، وهو أقل من القيمة العادلة المقدرة وفقًا لنموذج التدفقات النقدية المخصومة والبالغة 193.96 دولارًا أمريكيًا.
- يرى المتفائلون أن التوسع العالمي الذي لا يتطلب أصولاً ضخمة وتقنية الواقع الافتراضي الحصرية تبرر سعراً أعلى، ويؤكد هذا الرأي الفارق البالغ 40.3% عن القيمة العادلة وفقاً لتقدير التدفقات النقدية المخصومة. في الوقت نفسه، يشير ارتفاع نسبة السعر إلى المبيعات مقارنةً بالشركات المنافسة إلى أن السوق يتوقع بالفعل إيرادات أو هوامش ربح أقوى من القطاع ككل.
- يستخدم إطار عمل التدفقات النقدية المخصومة قيمة عادلة قدرها 193.96 دولارًا أمريكيًا. قد يرى المستثمرون الذين يركزون على التدفقات النقدية المخصومة مجالًا بين هذا الرقم و115.72 دولارًا أمريكيًا، بينما سيلاحظ أولئك الذين يركزون على المضاعفات نسبة 3.8 ضعف المبيعات مقارنةً بنسبة 2.2 ضعف لدى الشركات المماثلة.
- نظراً لأن الشركة غير مربحة ولا يُتوقع أن تحقق الربحية خلال السنوات الثلاث القادمة وفقاً لملخص المخاطر، فإن المقارنات التقليدية القائمة على نسبة السعر إلى الأرباح أقل فائدة في الوقت الراهن. وهذا يدفع بمزيد من الاهتمام إلى المقاييس القائمة على المبيعات وتقديرات القيمة العادلة المستندة إلى النماذج.
اتجاه الخسائر المتزايدة يغذي مخاوف المستثمرين المتشائمين
- وقد توسعت الخسائر خلال الاثني عشر شهرًا الماضية بنحو 24.6٪ سنويًا على مدى السنوات الخمس الماضية، ويظهر أحدث رقم سنوي خسارة قدرها 270.1 مليون دولار أمريكي إلى جانب توقعات الإيرادات بانخفاض سنوي بنسبة 0.08٪ في ملخص المخاطر.
- يؤكد المتشائمون أن الاحتياجات الرأسمالية الكبيرة، وارتفاع التكاليف، والمنافسة قد تحد من الربحية المستقبلية. ويتماشى هذا الرأي الحذر مع تزايد الخسائر في ظل توقعات لا تزال تشير إلى عدم تحقيق الربحية خلال ثلاث سنوات.
- يُظهر النمط الفصلي للسنة المالية 2025 خسائر في الربعين الأول والثالث، وربحاً واحداً فقط في الربع الثاني، إلى جانب ربحية السهم السلبية على مدى الاثني عشر شهراً الماضية والبالغة 7.43 دولار أمريكي. وهذا يختلف اختلافاً كبيراً عن أرقام الأرباح الإيجابية المستخدمة في سيناريوهات عام 2028 المتفائلة والمتشائمة على حد سواء.
- مع إيرادات تزيد قليلاً عن مليار دولار أمريكي في أحدث بيانات الأشهر الـ 12 الماضية وعدم وجود مقاييس هامش إيجابية في المدخلات، فإن المخاوف من أن التكاليف الثابتة واقتصاديات المكان قد تبقي صافي الدخل تحت الضغط تستند إلى الأرقام المعلنة، وليس مجرد رأي.
الخطوات التالية
للاطلاع على كيفية ارتباط هذه النتائج بالنمو طويل الأجل والمخاطر والتقييم، راجع مجموعة كاملة من روايات المجتمع لشركة Sphere Entertainment على موقع Simply Wall St. أضف الشركة إلى قائمة مراقبتك أو محفظتك حتى يتم تنبيهك عند تطور القصة.
هل ترى الأرقام بشكل مختلف؟ إذا كانت هذه البيانات تشير إلى اتجاه آخر، فيمكنك صياغة تلك الرؤية في سردك الخاص في غضون دقائق قليلة، بدءًا من "افعلها على طريقتك" .
تُعد تحليلاتنا التي تسلط الضوء على مكافأة رئيسية واحدة وعلامة تحذيرية مهمة واحدة قد تؤثر على قرارك الاستثماري نقطة انطلاق رائعة لأبحاثك في شركة Sphere Entertainment.
استكشف البدائل
لا تزال شركة Sphere Entertainment تسجل خسائر كبيرة، حيث بلغت خسائرها الصافية 270.1 مليون دولار أمريكي خلال الاثني عشر شهرًا الماضية، ولم تظهر أي مؤشرات إيجابية على هامش الربح حتى الآن.
إذا كنت ترغب في الحصول على أفكار ذات مخاطر أقل وعدم يقين بشأن الأرباح وملف مخاطر أكثر هدوءًا، فراجع 84 سهمًا مرنًا بدرجات مخاطر منخفضة وقارنها بسهم Sphere اليوم.
هذا المقال من Simply Wall St ذو طبيعة عامة. نقدم تعليقاتنا بناءً على البيانات التاريخية وتوقعات المحللين فقط، باستخدام منهجية محايدة، ولا يُقصد بمقالاتنا أن تكون نصائح مالية. لا يُشكل هذا المقال توصيةً بشراء أو بيع أي سهم، ولا يأخذ في الاعتبار أهدافك أو وضعك المالي. نهدف إلى تزويدك بتحليلات طويلة الأجل مدفوعة بالبيانات الأساسية. يُرجى ملاحظة أن تحليلنا قد لا يأخذ في الاعتبار آخر إعلانات الشركات الحساسة للسعر أو المعلومات النوعية. لا تمتلك Simply Wall St أي أسهم في أي من الشركات المذكورة.