
يرجى استخدام متصفح الكمبيوتر الشخصي للوصول إلى التسجيل - تداول السعودية
حسنًا
Timberland Bancorp (TSBK) Net Margin Strength Challenges Cautious Earnings Narratives
Timberland Bancorp, Inc. TSBK | 39.03 | +1.27% |
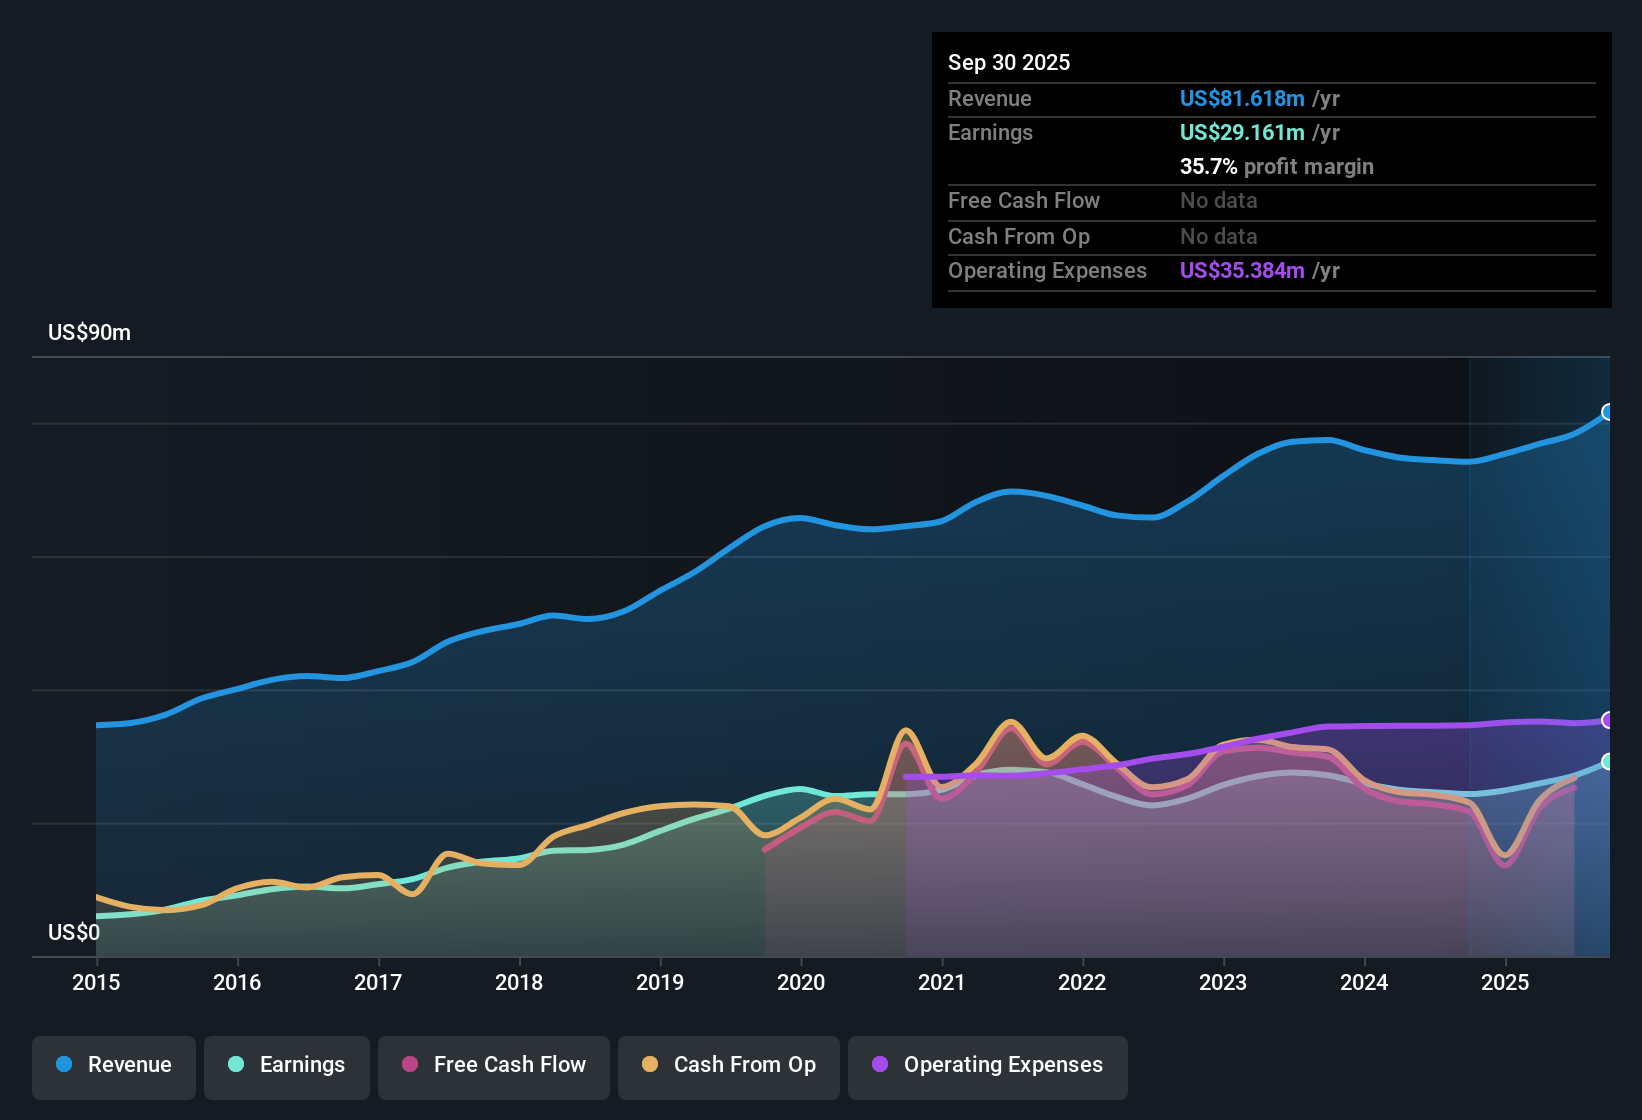
Timberland Bancorp (TSBK) opened fiscal 2026 with Q1 revenue of about US$21.7 million and basic EPS of roughly US$1.04, while trailing twelve month revenue stood at US$83.7 million and EPS at US$3.86, reflecting earnings growth of 22.8% over the past year. Over recent periods the company has seen quarterly revenue move from US$19.6 million in Q1 2025 to US$22.3 million in Q4 2025 before landing at US$21.7 million in Q1 2026, with basic EPS shifting from US$0.86 to US$1.07 and then to US$1.04 over the same stretch. With net profit margin at 36.4% and earnings described as accelerating relative to the five year trend, this set of results puts profitability at the center of how investors may read the latest quarter.
See our full analysis for Timberland Bancorp.With the numbers on the table, the next step is to see how this earnings profile lines up against the widely shared narratives around Timberland Bancorp and where those views might need a reset.
Don't just look at this quarter; the real story is in the long-term trend. We've done an in-depth analysis on Timberland Bancorp's growth and its valuation to see if today's price is a bargain. Add the company to your watchlist or portfolio now so you don't miss the next big move.
Timberland Bancorp’s 1.3% five year annualized earnings growth rate sits well behind the latest 22.8% step up, raising questions about consistency.
If that uneven history makes you cautious, use our stable growth stocks screener (2180 results) to focus on companies that aim for steadier revenue and earnings progress through different periods.
This article by Simply Wall St is general in nature. We provide commentary based on historical data and analyst forecasts only using an unbiased methodology and our articles are not intended to be financial advice. It does not constitute a recommendation to buy or sell any stock, and does not take account of your objectives, or your financial situation. We aim to bring you long-term focused analysis driven by fundamental data. Note that our analysis may not factor in the latest price-sensitive company announcements or qualitative material. Simply Wall St has no position in any stocks mentioned.
