

In Depth Research Analysis
From Themes to Industry Cycles: Earnings and Cash Returns in the AI Investment Cycle
Executive Summary
The difference between a market theme and an investable industry cycle lies in what sustains share prices. A theme primarily reprices the probability of commercial success. An industry cycle adds a sequence of verifiable orders, earnings and cash receipts that can support repeated forecast revisions. A common demand shock can lift many companies early in the cycle; differences in profit capture and capital requirements subsequently drive dispersion.
AI has already generated substantial infrastructure purchases and upstream earnings. The broader economic loop connecting end-customer payments, platform returns and the next round of investment remains unevenly validated. Industry expansion, corporate earnings and shareholder returns can therefore occupy different stages of the same cycle.
Our central view is that cash returns are becoming the main test of the next phase. Scarcity remains relevant where it supports economically sustainable purchasing. Applications and platforms provide important evidence of monetization, while hardware needs to be assessed through customers' purchasing capacity, capital returns and system efficiency. This does not establish that applications will outperform or that hardware demand has peaked.
This report connects industry research with the financial mechanisms behind security prices, reviews the AI cycle from 2023 through early November 2026, and sets out conditional scenarios and risks. It provides no security ratings, price targets or transaction instructions. The information cutoff is 4 November 2026.
1 Thematic Investing and Industry Cycles
1.1 Sustained earnings revisions change the basis of pricing
A theme values a commercial future that has not yet been fully validated. A technology advance, policy change or product launch can increase its probability of success without changing near-term profit. When customer payments, scalable delivery and competition remain uncertain, investors have limited scope to revise comparable earnings forecasts repeatedly. Prices consequently depend more on events, attention and capital flows. Further commercial evidence determines whether an initial revaluation persists.
Industry-cycle investing rests on a more observable transmission mechanism. Demand enters customer budgets, budgets generate orders, and orders become revenue and profit. Delivery, pricing, costs and market share provide a basis for updating earnings estimates. Shares still anticipate developments, but the object of anticipation moves from the possibility of technological success toward the amount and durability of future earnings.
The distinction used here concerns the evidence supporting prices, rather than holding period or a portfolio's sector label. A theme can last for years, and an established industry can experience a short thematic rally. Within one value chain, equipment suppliers may already be reporting profits while applications are still validating their business models. Different links can trade on different evidence at the same time.
NVIDIA's May 2023 results illustrate a transition toward financial validation. On 24 May, the company guided to approximately $11 billion of revenue for the following quarter, compared with a market expectation of roughly $7.15 billion. Its shares rose about 24% the next day. Customer purchasing had become strong enough to reset the near-term revenue baseline, converting a previously difficult-to-quantify technology opportunity into a forecast that subsequent results could test.[1][2]
1.2 Early broad rallies reflect a common demand shock
Early in a cycle, the market first revises the size of the opportunity. The more surprising the commercial evidence, the more likely existing forecasts are to underestimate several companies simultaneously. Exposure to the industry is relatively easy to identify; the eventual distribution of profit is harder to establish. A group of potential beneficiaries can therefore be repriced before investors can distinguish durable winners.
There is also an operating mechanism. A sudden increase in demand requires complementary inputs to expand together. Customers may prioritize delivery and temporarily become less sensitive to price or procurement discipline. Additional revenue spreads fixed costs over a larger base, allowing margins to improve across several links. Supply responses have not yet arrived, and the market has limited evidence separating lasting market-share gains from temporary shortage rents.
An early broad rally can thus combine a correction to previously underestimated industry earnings with a provisional allocation of value among uncertain beneficiaries. The first can have an earnings foundation; the second requires further verification. Neither establishes that every participant will earn an adequate return on capital or that the entire value chain must rise together.
1.3 Midcycle dispersion reveals profit capture and capital burdens
As orders and financial results accumulate, company differences become measurable. Technical leadership must translate into pricing power. Customer concentration, financing needs and receivables become visible. These distinctions increasingly matter alongside the size of the overall market. Demand can continue expanding while the profit it creates migrates between companies.
A supplier's higher selling price is a customer's higher cost. At sufficient scale, customers can respond through custom chips, alternative vendors, architectural changes and procurement negotiation. Competitor capacity also erodes shortage rents. Meanwhile, a supplier may receive cash well before its customer recovers the investment. Equipment vendors, cloud platforms and compute lessors consequently have different earnings quality, even when all report strong demand.
These mechanisms define the limits of the relevant analytical approaches. Theme research examines how an event changes the probability of success, the time available for validation and the conditions under which the thesis fails. It cannot simply borrow the compounding assumptions of a proven business. Industry research updates orders, earnings and capital returns while comparing them with the path already embedded in prices. Confusing a catalyst with commercialization is the first approach's main error; confusing industry growth with a satisfactory return for every company at every valuation is the second's.
2 What Makes an Industry Investable
2.1 An investable market needs repeat customer payments
A major technology trend needs several bridges to become a sustained opportunity in listed equities. Customers require a strong use case and an identifiable budget. Products must be delivered repeatedly. Businesses must retain some of the economic value they create, and listed securities must provide a meaningful claim on that value. A large technology market can coexist with poor shareholder outcomes if customers do not pay, competition transfers the benefits to users, or repeated financing dilutes existing owners.
The decisive question is whether expansion can support itself. Financing or strategic budgets can fund an initial procurement round. Repeated rounds ultimately require customer revenue, cost savings or other cash sources. When growth depends on accelerating external funding, the existence of demand and the sustainability of demand need separate assessment.
An investable upstream cycle does not require every end-market business model to be mature. Infrastructure can generate genuine orders and listed-company earnings before end-customer returns are established. Research must identify whether current profits rest on a self-replenishing economic process or on construction budgets whose eventual return is still being tested.
2.2 AI established a procurement loop first
AI connected to existing digital workflows and cloud procurement systems. Customers could test coding, search, customer support, content processing and data analysis without universally replacing devices or rebuilding physical service networks. Enterprise budgets, cloud delivery and payment systems already existed, allowing capability improvements to enter purchasing relatively quickly.
Major buyers also had cash flows from established businesses and faced platform competition. A platform could invest ahead of proven application returns to preserve technical capability, customer relationships and future options. This strategic motive allowed capital expenditure to lead end-market revenue. Spending was concentrated in compute, memory, networking and data centers that required advance procurement, enabling upstream suppliers to recognize revenue earlier.
Some critical technologies and integration capabilities were also scarce when demand accelerated. Profits could concentrate among a limited set of vendors. The combination of demand scale, purchasing capacity and supply constraints explains why AI became a substantial earnings cycle. Market size alone does not explain its strength.
Two loops need to be separated. The procurement loop runs from platform budgets to equipment delivery and supplier revenue and profit; this cycle has produced extensive financial evidence. The economic-return loop connects customer payments or productivity gains to application and platform cash returns, and then to the next investment round. Validation varies by business. The first loop can lead the second for a time, but cannot remain detached indefinitely.
Figure 1 Procurement can lead economic payback
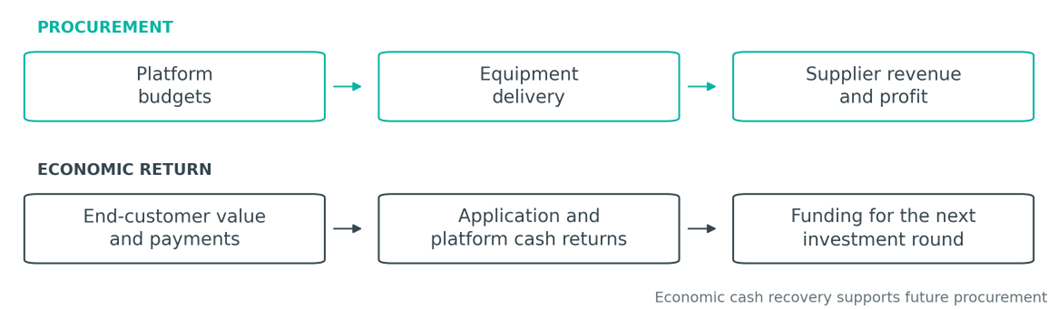
Source: Report analytical framework. Schematic only; arrows describe economic links, not measured flows or a timing forecast.
2.3 The metaverse requires several adoption conditions to coincide
The metaverse has real products and revenue. Its broader commercial vision, however, requires changes in devices, content, developer ecosystems and user behavior together. Better devices need not immediately create frequent usage; more users need not immediately increase payments. Content investment, in turn, requires an adequate audience. These interdependencies make a single product launch a weak basis for repeated earnings upgrades across an entire industry.
Meta's Reality Labs segment provides a bounded example. It reported approximately $2.274 billion of revenue and a $10.193 billion operating loss in 2021. In 2024, revenue was approximately $2.146 billion and the operating loss had widened to $17.729 billion. The segment includes AR and VR activities and does not represent the entire metaverse. It nevertheless shows that large development and hardware investments do not automatically generate comparable revenue expansion.[3]
Related shares may react to device launches, demonstrations or improved user metrics. Without repeated evidence of payments and profit, pricing between events can lack support. Meta's overall share price also reflects advertising, cost management and other activities, so it is not a clean measure of metaverse investment returns.
2.4 Physical AI must validate local operations and asset turnover
Robotaxis cannot all be classified as pre-commercial themes. In September 2026, Waymo announced that it provided autonomous rides in 14 cities, with access expanding gradually in some new markets. Genuine operations are growing.[6] Replicable shareholder economics still depend on revenue per vehicle, paid mileage, empty running, insurance, cleaning, maintenance, remote assistance and vehicle depreciation. Software can be reused; local operating requirements and capital commitments do not disappear when a new city opens.
Tesla unveiled Cybercab on 10 October 2024, and its shares fell nearly 9% the following day. A demonstration did not settle deployment timing, unit economics or the distribution of future profits. The reaction also reflected changes in other expectations and cannot establish a verdict on the entire autonomous-driving industry.[4][5]
Humanoid robots, robotaxis and established industrial robotics occupy different commercial stages. Compared with digitally distributed AI services, physical AI generally requires manufacturing individual assets, validating safety and building operating and maintenance capabilities. Real demand may therefore take longer to produce repeated, comparable earnings revisions in listed companies. That helps explain why some related share-price moves remain more dependent on discrete events.
3 Earnings Valuation and Share Prices Through the Cycle
3.1 Three conversions separate industry growth from equity returns
Industry revenue passes through competition, market share and costs before becoming company profit. Profit then passes through capital expenditure, working capital, interest and dilution before becoming distributable cash per share. Finally, the resulting cash trajectory must be compared with the growth already implied by the current price. The conclusions at these three levels can differ simultaneously.
With positive, comparable earnings, a share price can be expressed as earnings per share multiplied by a price-to-earnings ratio. Earnings capture operating results, while the multiple reflects expected growth duration, capital returns, risk and discount rates. Earnings improvement and multiple compression can coexist. Loss-making businesses or those undergoing major changes in investment intensity require normalized earnings and cash-flow analysis rather than mechanical use of current P/E ratios.
3.2 Early validation changes what investors value
Before commercialization is established, current profit may be small or negative. Investors mainly revise success probabilities and potential market size. Apparent multiple expansion can also represent the recognition of a business that previously carried little value. Product demonstrations, customer adoption and financing conditions can move prices well before financial statements confirm the opportunity.
As orders convert into revenue, operating leverage can amplify profit growth. NVIDIA's FY2025 first quarter, ended 28 April 2024, produced 262% year-over-year revenue growth and a 78.4% GAAP gross margin, compared with 64.6% a year earlier. Revenue expansion and margin improvement reinforced each other.[7]
At this stage, the useful evidence shifts toward order quality, delivery and retained profit. Repeating the technology thesis adds progressively less information. A demanding valuation can still be absorbed if realized earnings continue to grow faster than the path implied by the price, but that remains a condition to verify.
3.3 Rising shares can coexist with multiple compression
In NVIDIA's FY2025, split-adjusted GAAP EPS increased from $1.19 to $2.94, or approximately 147%, while fiscal-year total shareholder return was about 134%. In FY2026, EPS rose to $4.90, approximately 67% growth, while total return was about 32%. Earnings outpaced even the return measure that includes reinvested dividends, indicating compression in the historical earnings multiple over those periods despite positive shareholder returns.[8]
Figure 2 NVIDIA earnings outpaced total shareholder returns
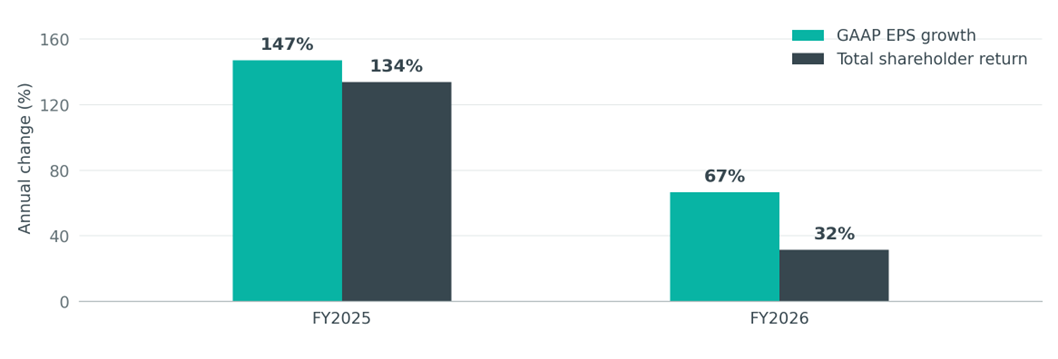
Source: NVIDIA FY2026 Form 10-K and report calculations.[8] EPS growth is split-adjusted and GAAP. Total return includes reinvested dividends. Fiscal years ended 26 January 2025 and 25 January 2026; rounded percentages.
This is one way earnings can catch up with an earlier valuation. It does not establish that growth will absorb every high multiple, nor does it measure a precise change in forward P/E. The outcome depends on the level and duration of earnings delivered, and on whether additional investment reduces future distributable cash.
3.4 Prices can turn before earnings and capacity
As supply catches up, pricing shifts from the next delivery toward future selling prices, margins and procurement durability. Current revenue can remain strong while the market shortens the period over which it expects exceptional profits. Multiple compression can precede earnings downgrades, with new capacity reaching inventory and financial statements later still.
Cisco recorded a $2.2 billion excess-inventory charge in its third quarter of fiscal 2001, even though revenue for the first nine months was still up 36%.[14] Strong cumulative growth can coexist with a current demand imbalance. Cumulative year-over-year figures react more slowly than new orders, delivery changes and customer inventories, making them insufficient as standalone turning-point indicators.
Share prices peaking before earnings, and earnings before capacity, is a possible sequence rather than a universal rule. Supply limits, long contracts, approvals and liquidity can change the order. Customer budgets, corporate earnings and market prices need separate timelines.
4 Strategy Mechanisms Across a Full Industry Cycle
4.1 Demand shocks reset the earnings baseline
NVIDIA's May 2023 guidance mattered because it changed the scale of near-term operating expectations. The technology story already existed; purchasing evidence made the previous revenue baseline inadequate. The analytical questions became whether orders were genuine, budgets were committed, delivery constrained revenue and the change would reach profit.[1][2]
The relevant financial mechanism is earnings revision. It remains informative while new operating evidence exceeds the trajectory already capitalized. After a major forecast reset, the old low baseline has disappeared. The growth threshold required for another positive surprise must be reassessed. Applying the first demand shock's logic to every subsequent earnings release overlooks this moving hurdle.
4.2 Delivery and positive surprise become different tests
On 28 August 2024, NVIDIA reported quarterly revenue of approximately $30.04 billion and guided to roughly $32.5 billion for the next quarter, above a market expectation near $31.8 billion. Its shares nevertheless fell more than 6% on 29 August. GAAP gross margin was 75.1%, below 78.4% in the preceding quarter, while the timing of new-product deliveries also attracted attention.[9][10]
Compared with May 2023, the revenue guidance beat relative to public consensus had narrowed substantially. A larger profit pool need not create a larger incremental valuation gain if investors already require repeated outperformance. Public consensus is also an imperfect proxy for what holders actually expect. Margins, transitions and cash conversion matter alongside headline revenue.
The event supports a hypothesis that the pricing standard had changed; one down day cannot establish an industry peak. Repeated reactions carry more information: whether upgrades generate sustained relative returns, whether small shortfalls trigger large repricing, and which financial variables increasingly explain dispersion. These are analytical observations rather than a mechanically tested trading rule.
4.3 Return scrutiny brings customer finances into supplier models
Early in an expansion, more customer capital expenditure normally means more supplier orders. The same expenditure is a cash outflow for the buyer and becomes depreciation and operating costs later. If monetization lags, the buyer's constraint can move from obtaining equipment to recovering investment and securing funding. Suppliers may continue reporting strong current revenue while longer-term purchasing assumptions are revised first.
Hardware analysis therefore extends beyond shortages, price increases and backlog. Customer cash generation, financing sources, project commissioning and revenue per unit of service must be connected. New equipment can improve output, or add underused assets and fixed obligations. Long contracts can reduce near-term volatility but do not eliminate delivery conditions, customer credit or renewal risk.
The financial mechanism is a reassessment of the capacity to sustain expansion. Differences emerge in cash buffers, responsibility for asset replacement and ability to pass through costs. Holdings spanning chips, optical links, memory and data centers can still share dependence on the same customers' investment budgets. Their labels may differ more than their economic risk.
4.4 Recovery can precede reported profitability
Micron reported approximately $30.758 billion of revenue and $8.687 billion of net income in FY2022. In FY2023, revenue fell to $15.540 billion and the company recorded a $5.833 billion GAAP net loss. Its annual-report shareholder-return chart, however, implies an approximately 23% decline across the 2022 August-end observation points and a roughly 25% recovery in 2023. These are approximate returns calculated from rounded indices and include reinvested dividends.[11][12]
Prices can recover during losses because they assess the next supply-demand balance. In June 2023, Micron disclosed DRAM and NAND wafer-start reductions approaching 30% from peak levels.[13] Supply restraint, inventory adjustment and investment changes can improve future pricing expectations while current earnings remain depressed. A loss itself is not the source of the recovery thesis.
That mechanism depends on credible supply discipline, stabilizing demand and the company's ability to survive the trough. If capacity exits are easily reversed, or financial pressure forces continued production at weak prices, an apparent bottom may lack support. Low peak-cycle P/E and trough losses can both mislead. Normalized earnings and balance-sheet capacity provide a more useful basis for evaluating this stage.
Across demand shocks, earnings delivery, return scrutiny and supply adjustment, the variables explaining future cash returns change. The financial approach cannot remain the same throughout the cycle simply because the industry continues to grow.
5 Translating Industry Views Into Security Risks
5.1 Similar exposure can represent different cash-flow claims
Technology suppliers, infrastructure operators and applications can all serve AI demand, but sell different economic products. A vendor can recognize revenue on delivery. A compute operator acquires equipment first and recovers its investment through years of service revenue. An application incurs inference, customer acquisition and implementation costs before retaining a share of customer payments. The same industry growth can support very different cash recovery periods and residual risks.
CoreWeave's second quarter of 2026 illustrates the distinction. Revenue was approximately $2.575 billion and adjusted EBITDA was $1.510 billion, a 59% margin. Depreciation and amortization were about $1.393 billion, net interest expense $640 million, and the GAAP net loss $626 million.[15] These figures do not establish that its projects lack economic value. They show why a measure excluding interest and asset consumption cannot substitute for shareholder cash returns. Equipment life, financing costs and replacement needs change the value of an order.
For an asset-intensive operator, analysis needs to reach a project or equipment cohort: capital committed, commissioning date, actual utilization, service pricing and cash remaining after power, maintenance and necessary replacement. Backlog and remaining performance obligations help describe demand, but a multiyear contract stock is neither current-quarter revenue nor cash already received. Oracle reported approximately $455 billion of remaining performance obligations in September 2025 against $14.9 billion of quarterly revenue; these are a cross-period stock and a single-period flow.[22]
5.2 Capital structure amplifies operating valuation changes
Equity receives the residual value after debt and other senior claims. In a simplified example, enterprise value of 100 and net debt of 60 imply equity value of 40. If enterprise value falls to 90 while net debt is unchanged, equity value becomes 30, a 25% decline. The example excludes other claims, taxes and share-count changes; it isolates the amplification mechanism.
An accurate industry view still requires a bridge from business profit to per-share value. Equity funding can support expansion while diluting existing holders. Debt funding can limit immediate dilution while increasing fixed payment obligations. Long contracts, secured financing and customer prepayments can transfer cash-flow risk between parties. The security-level questions concern who receives the return, who gets paid first and who bears the residual loss.
5.3 Instruments add timing and payoff conditions
Common equity bears changes in residual business value. Debt emphasizes interest, repayment, collateral and recovery. Options add expiry, strike and implied-volatility conditions. The direction, magnitude and timing of an industry outcome must align with the instrument's payoff. Expected demand growth alone cannot determine the result.
Consider a hypothetical stock at 100 and a call option with a strike of 100 purchased for a premium of 10. If the stock reaches 108 at expiry, the option is worth 8 and its holder loses 2 before fees. No actual product or quote is represented. A correct view on share-price direction can still fail to cover the instrument's cost. A multiyear industry thesis expressed through an instrument lasting months contains a timing mismatch of its own.
Indices, sector funds and individual shares also express different claims. Sector exposure contains index weights and business mixes; individual companies add market-share, execution and funding risks. A long-short structure can change market exposure while retaining relative operating risk. These distinctions explain sources of risk and are not instrument-selection or trading recommendations.
6 The AI Cycle From 2023 to Early November 2026
6.1 Procurement begins validating the opportunity in early 2023
Generative AI initially changed expectations about software capabilities and computing requirements. Usage could demonstrate interest without establishing payment or profit. NVIDIA's May 2023 guidance marked a key change: existing purchasing could materially reset near-term revenue estimates. Supplier financial results became a means of testing technological diffusion.[1][2]
The defining feature was that forecasts lagged the demand shock. Industry exposure initially received substantial weight. The debate moved from whether demand existed toward who could deliver under constrained supply. Applications still faced monetization uncertainty, while upstream procurement had already created revenue visibility.
6.2 Shortages become earnings from late 2023 to early 2024
Equipment deliveries and platform investment turned guidance into full-year results. NVIDIA's FY2024 data-center revenue reached approximately $47.5 billion, up 217%.[17] Capacity and system-delivery constraints concentrated incremental budgets in products that could be supplied. Revenue growth and margins reinforced earnings sensitivity.
Research broadened from GPUs toward high-bandwidth memory, advanced packaging, networking and optical interconnects. The mechanism was complementary investment, rather than a guaranteed sequence of rising component prices. A constraint in one link can limit effective use of others. A shortage matters financially when it combines system necessity, a meaningful capacity-response lag and the ability to retain profit.
6.3 System upgrades in 2024 broaden exposure and raise the hurdle
The Blackwell platform announced in March 2024 shifted attention toward system integration, including liquid-cooled racks and closer coordination among chips and networking.[16] This increased the relevance of power, cooling and communications while adding deployment complexity. System configuration and architecture began to matter alongside unit volumes in determining value distribution.
By August 2024, revenue exceeding public consensus no longer guaranteed a positive share-price response.[9][10] The size of the beat, margins and product-transition timing mattered together. Expansion continued, but having orders and having enough orders to support the prevailing valuation had become separate tests.
6.4 Reasoning demand meets efficiency gains in late 2024 and early 2025
The o1 research released in September 2024 showed how additional computation during inference could improve model performance. The demand discussion consequently expanded from training toward computation during use.[19] This introduced another mechanism for continuing compute requirements, while leaving the relationship among task intensity, service pricing and customer usage to be tested.
DeepSeek-R1's January 2025 release renewed scrutiny of the resources required to deliver AI capabilities. NVIDIA's shares fell approximately 17% on 27 January.[20][21] More efficient models can lower adoption barriers while challenging prior assumptions about resources per task. The long-run spending result depends on whether lower costs generate enough additional usage and more complex tasks; efficiency alone does not settle the direction of aggregate compute demand.
Product transitions also created uneven outcomes within the value chain. In NVIDIA's FY2025 fourth quarter, data-center revenue grew 93% year over year while networking revenue fell 9%. Its financial commentary discussed system-architecture and networking-product transitions.[18] Strong aggregate demand did not ensure that every component followed the same growth rate.
6.5 Physical delivery and funding matter more in 2025 and 2026
As installed investment increased, grid connection, commissioning and the conversion of equipment into saleable services became more important. The International Energy Agency's April 2026 analysis identified bottlenecks involving transformers, gas turbines, chips and power grids.[23] A chip order is not commissioned compute capacity, and a signed contract is not immediately realizable cash.
Compute operators' financing and depreciation became central to industry analysis. CoreWeave's second-quarter 2026 results show how high revenue and adjusted EBITDA can coexist with a substantial net loss.[15] Genuine demand does not remove the requirements of asset recovery and funding cost. Delayed projects can defer revenue while financing expenses accumulate, allowing financial stress to emerge before final demand changes.
6.6 Cash returns become central in late 2026
The latest upstream results available at the cutoff do not establish a broad hardware-demand contraction. NVIDIA's FY2027 second quarter, reported in August 2026, generated approximately $96.2 billion of revenue, up 106%, including $89.0 billion of data-center revenue, up 117%.[24] These supplier results cannot independently establish how quickly customers can increase their next investment budgets.
The October cloud results made the funding question more visible. Microsoft's FY2027 first-quarter Azure revenue grew 48%. Operating cash flow was $58.0 billion, cash purchases of property and equipment $39.4 billion, and free cash flow $18.6 billion. Amazon's third-quarter AWS revenue grew 39%, but group trailing-twelve-month free cash flow was negative $42.4 billion, principally reflecting increased AI-related asset investment according to the company.[25][26]
Alphabet's third-quarter Google Cloud revenue grew 103%, including a contribution from TPU systems sales. Group operating cash flow was $42.290 billion, cash capital expenditure $51.355 billion and quarterly free cash flow negative $9.065 billion. Inventory movements and an approximately $5.2 billion one-off fine payment also affected cash performance; trailing-twelve-month free cash flow remained positive.[27][28]
On 29 October, Microsoft shares were broadly unchanged while Alphabet fell more than 12%. Amazon reported subsequently and declined approximately 6.5% in extended trading.[29] The divergence is consistent with greater scrutiny of cash generation and spending constraints, but search performance, one-off items, valuations and prior expectations also influenced prices. It cannot be attributed exclusively to AI investment. The more significant analytical change is the need to evaluate cloud growth, its funding and capital recovery together.
7 Industry Implications of the Return Test
7.1 Cash returns make the scarcity thesis conditional
Our central analytical question for the next phase is which businesses enable the system's investment to remain economically supportable. Shortages can still influence revenue and bargaining power. Their value depends on customers having both an economic reason and the resources to keep purchasing. A bottleneck that raises system costs or delays commissioning can lengthen payback, weaken customer capacity and eventually constrain the supplier itself.
Applications and platforms become important verification points. How many tasks customers pay for, whether payments recur and whether service revenue covers inference, acquisition and implementation costs will determine how reliably end-user money replenishes infrastructure investment. Downstream evidence matters because it tests returns. An application label alone cannot establish superior security returns.
Hardware analysis also changes. Products that improve utilization, lower the cost of useful output, reduce energy use or accelerate deployment may directly strengthen customer economics. Products earning high prices mainly from temporary scarcity depend more on shortage duration and customer tolerance. Both are hardware, but their contribution to the return loop differs.
Our conclusion is therefore not a fixed rotation from hardware into applications. Value distribution increasingly depends on contributions to cash recovery across commercialization, platform capital efficiency and hardware system efficiency. Following a substantial hardware repricing, a separate question can also arise: whether procurement slows less than prices already imply. That is different from proving that scarcity will persist.
7.2 The narrative changes when the binding constraint changes
Early in the expansion, limited equipment availability was a principal constraint. More investment could increase supply and support revenue. As capital accumulated, equipment generated depreciation, power commitments, financing obligations and replacement needs. Investors increasingly asked whether incremental revenue could cover these burdens. The return test becomes more important as commitments accumulate; it need not wait for final demand to fall.
This explains why the narrative can change before supplier earnings. If incremental platform cash returns lag, platforms can adjust project schedules, funding and budget priorities while existing orders still support suppliers. Prices can revise the next procurement round first. Subsequent order evidence determines whether the concern is a temporary valuation reset or an operating downturn.
Negative free cash flow alone does not establish poor investment returns. Growth expenditure occurs today while new assets can generate returns later. Established businesses can support a construction phase. One-off payments, working capital, finance leases and commissioning need to be separated. Comparing investment and recovery by project cohort is more informative than charging all current growth capex against current AI-service economics.
7.3 Price dispersion needs corroborating operating evidence
One signal is a change in responses to similar news. If capex increases produce less sustained relative appreciation while cash consumption, financing requirements and payback receive greater penalties, the old demand signal may no longer be sufficient. Multiple companies and events are required. Market moves, expectation baselines and simultaneously disclosed information need to be considered before inferring a persistent shift.
A second signal is cross-sectional dispersion. Companies with similar revenue growth may trade differently because of customer quality, cash generation and dependence on financing. Growth at one platform can benefit some suppliers while hurting others through substitution or direct competition. Once value distribution dominates, industry association alone becomes an inadequate explanation of returns.
A third signal is the translation of concerns into decisions. Budget growth, project delays, commissioning, collections and financing costs sit closer to a procurement turn than general sentiment. Interpretation strengthens when market reactions connect with these operating changes. Delays caused by delivery constraints need to be distinguished from voluntary cuts caused by inadequate returns; their demand implications differ.
7.4 Application monetization must still pass the valuation test
Palantir's third-quarter 2026 results, released on 2 November, reported approximately $2.313 billion of revenue, up 96%, and operating cash flow of $1.205 billion. They demonstrate material software revenue and cash generation. These are companywide figures, including government and other activities, rather than a measure of incremental AI revenue alone.[30]
Its shares nevertheless fell nearly 3% in extended trading. US commercial total contract value grew 11% year over year, a substantial slowdown from the preceding quarter's growth rate; changes in contract duration also affected comparability.[30][31] Commercial delivery and stock returns remain separate questions. Growth, bookings, durability and the expectations embedded in prices influence the result together. Return scrutiny in hardware does not exempt applications from those conditions.
Application evidence needs to include renewals and expansion, conversion from deployment to payment, margins after model calls and implementation, and the conversion of incremental revenue into cash. Competition can pass productivity gains to customers, allowing usage to grow while revenue per unit falls. At platforms, incremental AI benefits need to be distinguished from existing-business income and other investment. Group free cash flow is not a direct measure of an individual AI project's return.
8 How AI Changes Industry Cycles and Research
8.1 Faster information processing leaves physical lags in place
AI can shorten the time needed to organize financial disclosures, map value chains and calculate scenarios. Public information may enter common expectations faster. Whether this makes markets uniformly more efficient or shortens all excess-return windows requires separate evidence. Tool capabilities alone cannot establish that every opportunity disappears within days.
The gap between information processing and physical delivery may widen. Models and chip architectures can change rapidly, while grids, buildings, manufacturing and customer implementation take time. Markets can repeatedly revalue distant projects whose construction commitments cannot be reversed equally quickly. Price, earnings and capacity clocks consequently remain capable of diverging.
Research competition is likely to concentrate more on questions that disclosures do not directly answer: real customer budgets, utilization, payback, substitution and profit distribution. Summarizing the same announcement faster need not produce an independent conclusion. Establishing how much the consensus already covers, and which operating changes would invalidate it, remains substantive analytical work.
8.2 Efficiency changes both total demand and who captures value
Lower cost per task reduces resources required for existing work. It can also expand usage, encourage more complex tasks and create new demand. Aggregate compute spending depends on usage responding to changes in cost and capability. A lower inference cost per task cannot independently establish the direction of total spending.
Profits can migrate even when aggregate demand grows. More efficient chips and networks can lower platform costs; platform competition can transmit the benefit through lower service prices; applications can pass some further benefit to enterprise customers. Productivity gains may ultimately accrue to ordinary businesses using AI as well as to technology vendors.
Bottleneck migration therefore needs to be studied alongside value retention. An essential engineering component may earn modest capital returns if alternatives are available, capacity expands quickly or buyers have bargaining power. A less technically prominent business may retain more value through customer access, proprietary workflow data or implementation capability.
8.3 Rapid iteration raises economic depreciation risk
An asset can remain on the balance sheet and physically operate while losing economic competitiveness. If new equipment substantially improves unit costs, older assets may need lower service prices or a shift toward less valuable workloads. Continuing cash generation depends on actual performance, customer tasks and market pricing, rather than physical usability alone.
Older equipment can also remain useful because demand expands, workloads are tiered and existing contracts persist. Analysis needs to compare revenue and costs across equipment cohorts rather than assume immediate obsolescence. Faster iteration makes the alignment of investment, economic life and contract duration more important, increasing the limitations of an industry model based only on unit growth.
9 Outlook and Risk Assessment
9.1 Base case combines continued demand with divergent capital returns
Supplier revenue and cloud growth support the existence of substantial purchasing. Platform cash flows and project investment show why return validation is gaining weight. Our base case is continued industry expansion with different links entering different financial tests. Differences between growth and retained value are likely to explain more company dispersion than demand growth alone.
Evidence needs to connect end-customer payments, platform capital efficiency and hardware system efficiency. Physical supply constraints can persist, but their valuation significance depends on how much durability prices already require and whether buyers convert equipment into useful economic output. This scenario does not presume a direction for sector or individual security prices.
9.2 Upside requires commercial cash recovery to catch up
If paid adoption, customer renewals and productivity gains improve, platforms can generate more revenue and cash per unit of capital, providing stronger economic support for additional purchases. Applications, platforms and hardware could benefit together. There is no necessary rotation sequence. If efficiency both lowers costs and expands usage, physical bottlenecks may persist at a higher demand level.
Verification rests on incremental commercial cash rather than user counts alone, utilization and revenue rather than contract totals alone, and recovery after necessary replacement investment. Better group free cash flow needs attribution: slower spending, fading one-off payments and stronger operating economics have different implications for subsequent procurement.
9.3 Downside begins when weak returns constrain funding
If customer payments lag, service prices decline faster than costs improve, or financing and replacement burdens rise, platforms and operators may reprioritize budgets. Pressure can first appear in project timing, contracts and funding, then reach equipment orders, prices and earnings growth. Local shortages can coexist with weaker aggregate procurement and do not disprove system-level return pressure.
Applications are not automatically insulated. Businesses relying on subsidized inference, low-margin implementation or repeated financing can come under pressure alongside infrastructure. Even commercially successful companies can reprice if growth falls short of the assumptions capitalized. The risks take different forms across the chain.
9.4 Evidence that would change the assessment
Repeated evidence across platforms that incremental AI revenue and cash recovery are outpacing investment, with shorter project payback and hardware orders supported by real usage, would strengthen the expansion case. Persistent procurement cuts despite better monetization, or substitution that materially reduces a component's requirements, would weaken that component's durability assumptions.
Conversely, a shift from delivery delays toward voluntary project reductions, deteriorating collections or customer credit, and funding constraints on construction would weaken the base case even if current supplier revenue continued growing. Post-earnings price reactions help identify the variables markets emphasize; operating changes provide the principal test of the scenarios.
9.5 Principal risks
Commercialization risk. Trials, usage and contract values may fail to produce adequate recurring payments. Inference costs, price competition and implementation can compress application economics. Cloud growth includes non-AI businesses, while activities such as custom-chip sales can alter historical comparability.
Capital and credit risk. Construction commitments, asset replacement, interest and concentrated customers can amplify cash volatility. Orders and remaining performance obligations may depend on delivery, cancellation and credit conditions. Adjusted EBITDA and adjusted free cash flow do not replace GAAP measures or a full cash-flow assessment.
Technology and supply risk. Model efficiency, custom silicon, system architecture and product transitions can change resource requirements and profit distribution. Delayed capacity can constrain delivery; excess expansion can pressure inventories and prices. Accounting asset lives can differ from economic lives.
Macroeconomic and policy risk. Interest rates, energy costs, exchange rates, export restrictions, tariffs, data rules, safety and competition regulation can change costs, access and valuations. Physical AI additionally faces liability, insurance and local deployment permissions that can materially alter commercialization schedules.
Market and methodology risk. Valuation, crowded exposure and liquidity can move prices sharply before operating fundamentals deteriorate. Historical events contain simultaneous information, do not establish a single cause and are not backtests of executable strategies. Case selection, measurement dates and hindsight can influence interpretation. No probabilities or security returns are assigned to the scenarios.
Data and Methodology Notes
The information cutoff is 4 November 2026. Financial data primarily come from company disclosures and US Securities and Exchange Commission filings; event returns use contemporaneous public reporting. Interpretations and scenarios are the report's analysis. Amounts are in US dollars and growth rates are year over year unless stated otherwise. Figures are rounded where appropriate. Citation numbers link the discussion to the references below.
Fiscal years and calendar years differ. NVIDIA's fiscal year ends around January of the following calendar year. Microsoft's FY2027 first quarter ended on 30 September 2026; CoreWeave's second quarter ended on 30 June 2026. Publication dates are not accounting-period end dates. Fiscal and quarterly labels are retained to avoid implying synchronous measurement.
Free cash flow is generally operating cash flow less cash purchases of property and equipment, but definitions, lease treatment and adjustments differ. Microsoft's cash capital expenditure differs from its capex measure including finance leases. Amazon's cited free cash flow is a group trailing-twelve-month measure, while the other principal cloud examples are quarterly. They should not be ranked directly. Group measures are not individual AI-project returns.
Total shareholder return includes reinvested dividends and differs from share-price appreciation. NVIDIA fiscal-year returns are calculated from cumulative indices in its FY2026 annual report. Micron returns are approximations from rounded annual-report indices at August-end observation dates, which can differ slightly from fiscal year ends. NVIDIA EPS is split-adjusted. No precise forward-valuation change or executable backtested portfolio is inferred.
The capital-structure and option examples are simplified assumptions, not actual quotations, product terms or expected returns. Figure 1 is a conceptual framework, not measured capital flows or a timing forecast. Figure 2 presents historical data on the stated fiscal-year basis. Event reactions illustrate pricing mechanisms without isolating causation. Future growth, project recovery and value distribution remain uncertain.
Source References
[1] NVIDIA. NVIDIA Announces Financial Results for First Quarter Fiscal 2024. 24 May 2023. FY2024 Q1 revenue and subsequent-quarter guidance.
[2] Reuters. Nvidia forecasts second-quarter revenue above estimates, 24 May 2023; Wall Street ends higher as Nvidia sparks rush for AI stocks, 25 May 2023. Consensus revenue expectation and the next-day share-price response.
[3] Meta Platforms. Fourth Quarter and Full Year 2021 Results, February 2022; 2024 Form 10-K, January 2025. Reality Labs revenue, operating losses and segment scope for 2021 and 2024.
[4] Tesla. Q3 2024 Update. 23 October 2024. Cybercab presentation and autonomous-driving business context.
[5] Reuters. Tesla robotaxi event was long on promises, but investors wanted more details. 11 October 2024. The next-day share-price reaction.
[6] Waymo. Ride in Denver, San Diego, and Tampa. 1 September 2026. Service-city count and phased access; does not imply identical service availability or financial results in each city.
[7] NVIDIA. NVIDIA Announces Financial Results for First Quarter Fiscal 2025. 22 May 2024. Revenue growth and GAAP gross margins.
[8] NVIDIA. FY2026 Form 10-K, filed 25 February 2026, fiscal year ended 25 January 2026. Split-adjusted GAAP EPS and total-shareholder-return indices; return calculations by this report.
[9] NVIDIA. NVIDIA Announces Financial Results for Second Quarter Fiscal 2025. 28 August 2024. Quarterly revenue, next-quarter guidance and GAAP gross margin.
[10] Reuters. Nvidia's rally takes a break after forecasts fall short of investor expectations. Updated 29 August 2024. Approximately $31.8 billion consensus revenue expectation and the greater-than-6% regular-session decline on 29 August.
[11] Micron Technology. Reports Results for the Fourth Quarter and Full Year of Fiscal 2023. 27 September 2023. FY2022 and FY2023 revenue and GAAP net income or loss.
[12] Micron Technology. 2023 Annual Report. October 2023. Shareholder-return chart, observation dates and approximate return calculations.
[13] Micron Technology. Reports Results for the Third Quarter of Fiscal 2023. 28 June 2023. DRAM and NAND wafer-start reductions.
[14] Cisco Systems. Cisco Systems Reports Third Quarter Earnings. 8 May 2001. Excess-inventory charge and first-nine-month revenue growth.
[15] CoreWeave. Second Quarter 2026 Earnings Release. 11 August 2026. SEC Exhibit 99.1. Revenue, adjusted EBITDA, depreciation and amortization, net interest and GAAP net loss.
[16] NVIDIA. NVIDIA Blackwell Platform Arrives to Power a New Era of Computing. 18 March 2024. System architecture and liquid-cooled rack context.
[17] NVIDIA. NVIDIA Announces Financial Results for Fourth Quarter and Fiscal 2024. 21 February 2024. FY2024 data-center revenue and growth.
[18] NVIDIA. CFO Commentary on Fourth Quarter and Fiscal 2025 Results. 26 February 2025. Data-center and networking revenue changes and system-transition context.
[19] OpenAI. Learning to reason with LLMs. 12 September 2024. Research on inference-time computation and model performance.
[20] DeepSeek. DeepSeek-R1 Release. 20 January 2025. Release timing; not a basis for estimating complete training or deployment costs.
[21] Reuters. China's DeepSeek sets off AI market rout. 27 January 2025. NVIDIA's approximately 17% one-day share-price decline.
[22] Oracle. Oracle Announces Fiscal Year 2026 First Quarter Financial Results. 9 September 2025. Remaining performance obligations and quarterly revenue, respectively a contract stock and revenue flow.
[23] International Energy Agency. Data centre electricity use surged in 2025 even with tightening bottlenecks, driving a scramble for solutions. 16 April 2026. Grid, equipment and data-center delivery constraints.
[24] NVIDIA. NVIDIA Announces Financial Results for Second Quarter Fiscal 2027. 26 August 2026; quarter ended 26 July 2026. Latest available quarterly revenue and data-center revenue at the report's cutoff.
[25] Microsoft. FY2027 Q1 Earnings Conference Call and accompanying financial materials. 28 October 2026; quarter ended 30 September 2026. Azure growth, operating cash flow, cash capex and free cash flow.
[26] Amazon. Amazon.com Announces Third Quarter Results. 29 October 2026. AWS growth and group trailing-twelve-month free cash flow through 30 September 2026.
[27] Alphabet. Alphabet Announces Third Quarter 2026 Results. 28 October 2026. SEC Exhibit 99.1. Google Cloud revenue, operating cash flow, cash capex and free cash flow.
[28] Alphabet. 2026 Q3 Earnings Call. 28 October 2026. TPU sales, inventory and one-off cash-payment context.
[29] Reuters. Cash is king, as investors draw new battle lines in AI spending boom; US STOCKS - Wall Street ends lower as Alphabet revenue miss revives AI capex jitters. 29 October 2026. Microsoft and Alphabet regular-session reactions and Amazon extended trading, with session distinctions retained.
[30] Palantir Technologies. Third Quarter 2026 Earnings Release. 2 November 2026. SEC Exhibit 99.1. Companywide revenue, operating cash flow and contract metrics; not a pure-AI revenue measure.
[31] Reuters. Palantir forecasts strong quarterly revenue on AI demand. 2 November 2026. Extended-trading reaction, not the following session's closing return.
Disclaimer
Sahm Capital Financial Company is subject to the supervision and control of the Capital Market Authority (CMA), pursuant to license no. 22251-25 issued by the CMA.
This report is for general information and research purposes only. It does not constitute an offer to sell, a solicitation to buy, or advice or a recommendation concerning any security, financial instrument or investment. It does not consider any particular reader's objectives, financial position, experience or risk tolerance. Before making investment decisions, readers should seek professional financial advice and independently assess suitability in light of their circumstances.
Information has been obtained or compiled from company announcements and regulatory filings, official disclosures, industry organizations and other public sources believed to be reliable. Sahm Capital Financial Company does not guarantee its accuracy, completeness or timeliness. Opinions and scenarios reflect analysis at publication and may change as information develops. No commitment to ongoing updates is made.
Past performance is not indicative of future results. Forward-looking statements and scenarios involve risks and uncertainties, and actual outcomes may differ materially. Prices, returns and liquidity can fluctuate, and investors may lose part or all of their capital. Selected cases and hypothetical examples do not represent an actual portfolio or achievable returns.
To the extent permitted by applicable law, Sahm Capital Financial Company accepts no liability for direct, indirect, special, incidental or consequential loss arising from reliance on, use of, or inability to use the information in this report, even if advised of the possibility of such loss. No part of this report may be reproduced, modified or distributed without authorization.