We Value Your Feedback! Help us shape better content and experiences by participating in our survey. Join the Survey Now!
Saudi Market
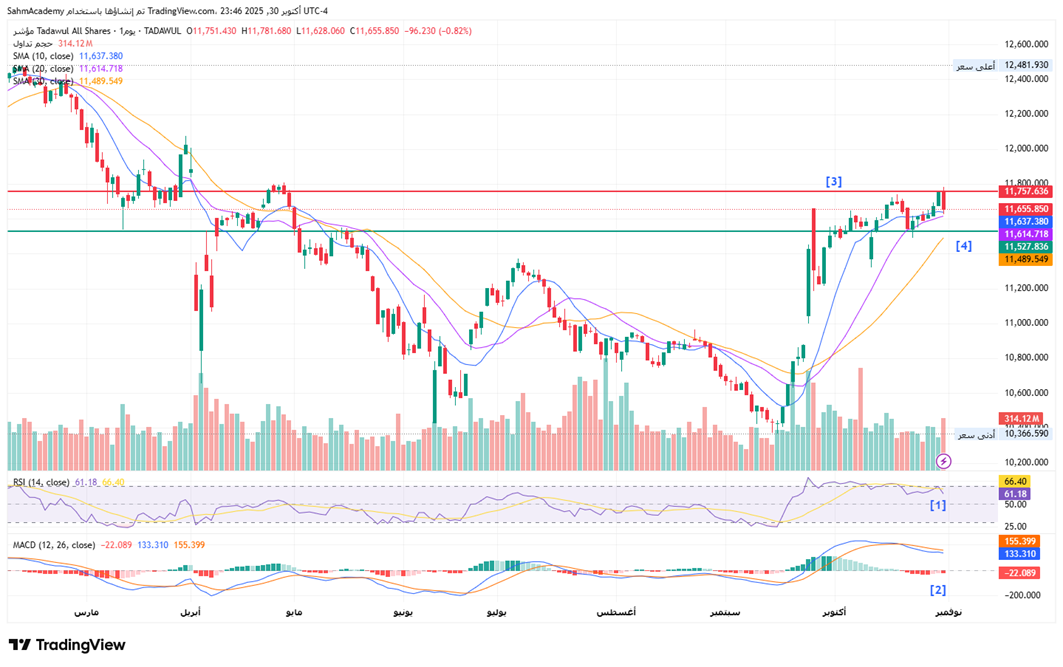
TASI Technical Analysis:
The Tadawul All Shares Index is currently displaying a compelling recovery pattern. The index has recently broken above its 10-day and 20-day simple moving averages, which are now in bullish alignment, with the 30-day SMA at 11,489.549 providing dynamic support.
[1] From a momentum perspective, critical divergences are emerging that warrant cautious optimism. The RSI indicator at 61.18 remains in overbought territory but has not yet triggered a sell signal, indicating robust buying pressure without extreme exhaustion.
[2] MACD histogram has recently transitioned from deeply negative territory to moderately positive, with the signal line crossing above zero—a textbook bullish confirmation.
[3] The index faces resistance at 11,757.636. Until TASI decisively breaks above 11,757.636 on heavy volume, this recovery should be treated as a counter-trend bounce from oversold conditions rather than a definitive trend reversal.
[4] Key support levels are identified at 11,528.
TASI Index Weekly Market Summary (October 26 to October 30)
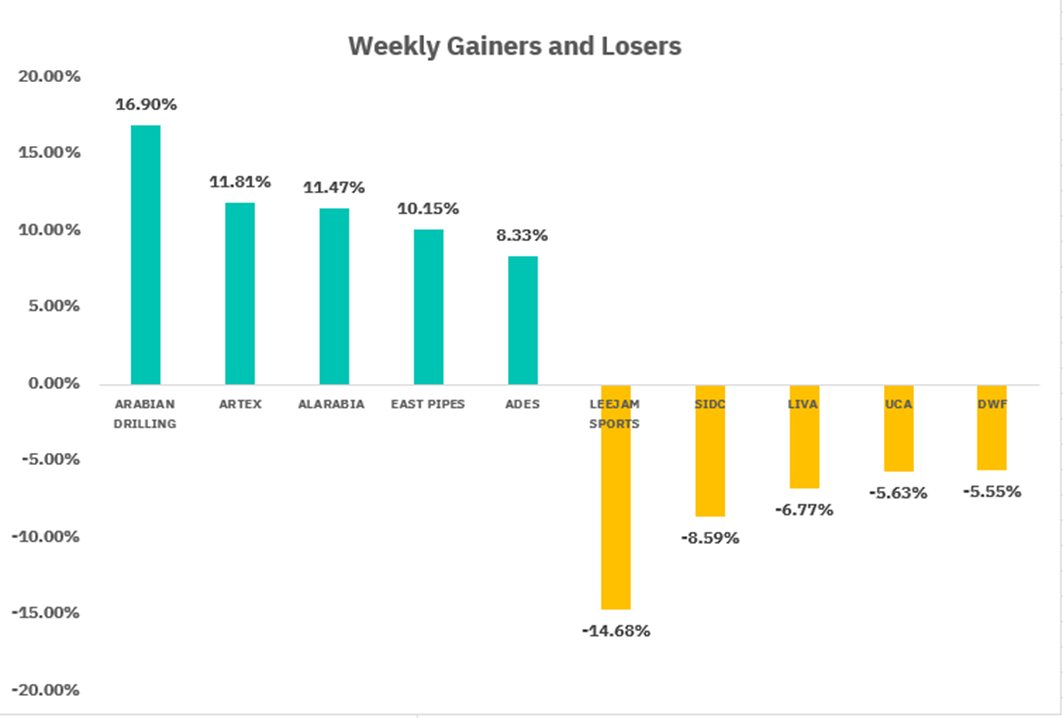
The TASI index increased by 0.54%. With a trading week of 5 days, the total trading volume reached 27 billion Saudi Riyals, averaging 5.4 billion per day.
From the perspective of individual stock performance, 144 companies saw their stock prices rise this week, while 124 companies saw their stock prices fall. The companies with the highest increase included ARABIAN DRILLING, ARTEX, ALARABIA, with increases of 16.90%, 11.81%, and 11.47% respectively. The companies with the highest decline included LEEJAM SPORTS, SIDC, LIVA with declines of 14.68%, 8.59%, and 6.77% respectively.
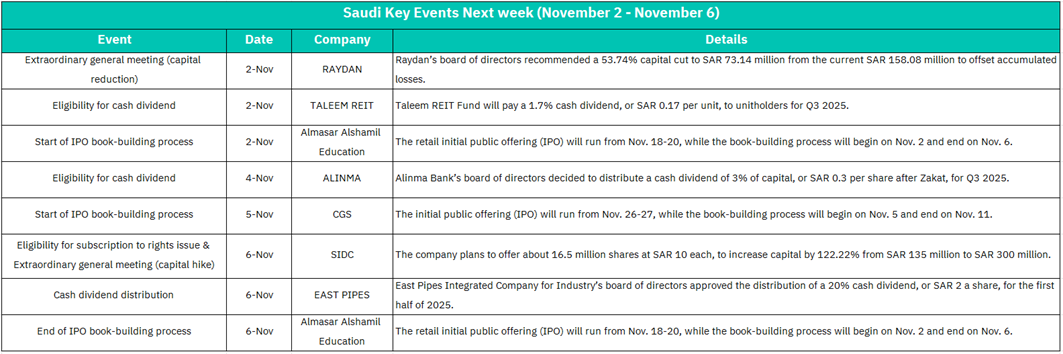
November 2:
RAYDAN - The board recommends a 53.74% capital reduction to SAR 73.14 million from SAR 158.08 million to offset accumulated losses.
TALEEM REIT - The fund will pay a 1.7% cash dividend (SAR 0.17 per unit) to unitholders for Q3 2025.
Almasar Alshamil Education - Start of IPO Book-Building: The book-building process begins for the retail IPO (offering period: Nov 18-20).
Market Impact:
The capital reduction at RAYDAN signals financial restructuring to address losses, which may create short-term volatility but could improve the company's balance sheet long-term. TALEEM REIT's dividend announcement is positive for income-focused investors and may support REIT sector sentiment. The start of Almasar Alshamil's IPO book-building could attract liquidity to the education sector and generate broader market interest in new listings.
November 4:
ALINMA - Alinma Bank will distribute a 3% cash dividend (SAR 0.3 per share after Zakat) for Q3 2025.
Market Impact: This dividend announcement from a major banking institution reinforces the financial sector's strong profitability and shareholder-friendly policies. It should provide positive momentum for banking stocks and support overall market sentiment, particularly benefiting income investors and institutional portfolios with banking exposure.
November 5:
CGS - Start of IPO Book-Building: The book-building process begins for CGS's IPO (offering period: Nov 26-27, ending Nov 11).
Market Impact: Another IPO book-building launch indicates continued capital market activity and investor appetite for new listings. This could temporarily divert liquidity from secondary markets as institutional investors allocate funds for the IPO subscription, though it demonstrates healthy primary market dynamics.
November 6:
SIDC - Eligibility for Rights Issue & EGM (Capital Hike): The company plans to offer 16.5 million shares at SAR 10 each, increasing capital by 122.22% from SAR 135 million to SAR 300 million.
EAST PIPES - Cash Dividend Distribution: The board approved a 20% cash dividend (SAR 2 per share) for the first half of 2025.
Almasar Alshamil Education - End of IPO Book-Building: The book-building process concludes.
Market Impact: SIDC's significant capital increase of 122% represents major expansion plans and could dilute existing shareholders in the short term, though it signals growth ambitions. EAST PIPES' generous 20% dividend (SAR 2/share) is highly positive for the industrial sector and demonstrates strong cash generation. The conclusion of Almasar Alshamil's book-building may reveal pricing details and initial investor demand, providing insights into IPO market conditions. Overall, Wednesday features the most impactful corporate actions with substantial capital allocation decisions that could influence sector-specific and broader market sentiment.
U.S. Market
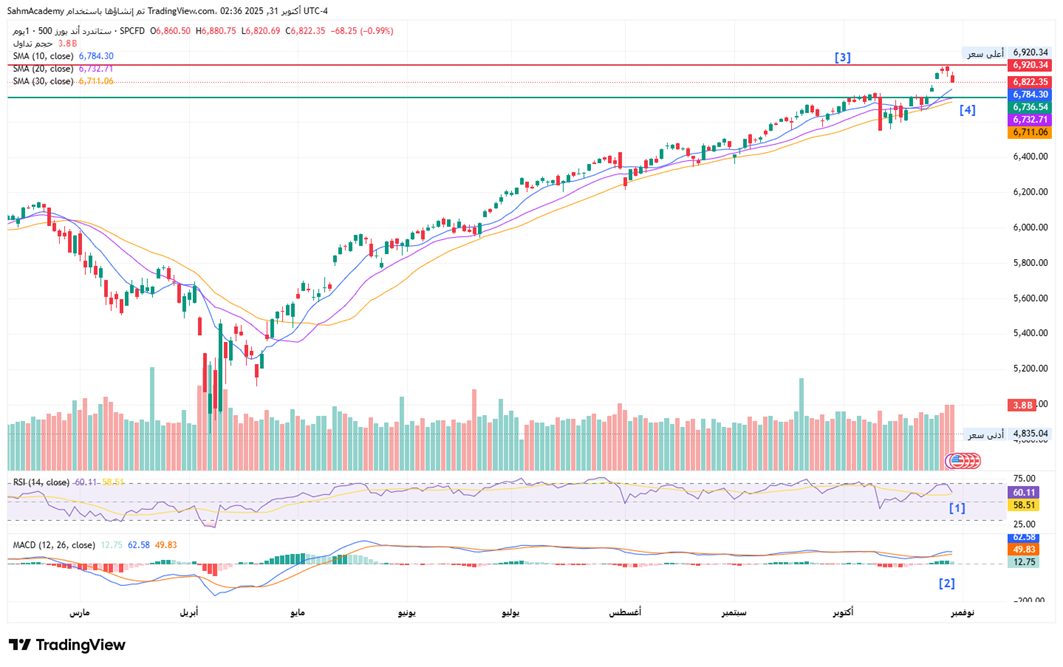
S&P500 Technical Analysis:
The S&P 500 is exhibiting a textbook bull market configuration with price action decisively above all major moving averages in bullish alignment. Current price at 6,822.35 sits comfortably above the 6,800 psychological level, with the index approaching its all-time high near 6,920.34. Volume metrics remain healthy at 3.88B shares, and the construction of higher lows around the 6,750-6,780 zone indicates strong floor-building activity by long-term investors.
[1] From a momentum standpoint, the SPX displays characteristics of a mature but still-valid bull run requiring careful attention to overbought conditions. The RSI at 60.11 sits comfortably in the 50-70 range, suggesting strength without extreme exhaustion that would typically precede a significant correction.
[2] The MACD indicator, with the histogram at 49.83, shows the blue signal line tracking near the orange centerline—indicating that momentum, while constructive, may be moderating from its previous exuberance.
[3] Near-term resistance materializes at 6,920, and a close above this level would target 7,000.
[4] Intermediate support around 6,736.
Given the maturity of this rally, traders should monitor for either a clean breakout through 6,920 or any reversal signals in the RSI/MACD complex before committing fresh capital to long positions.
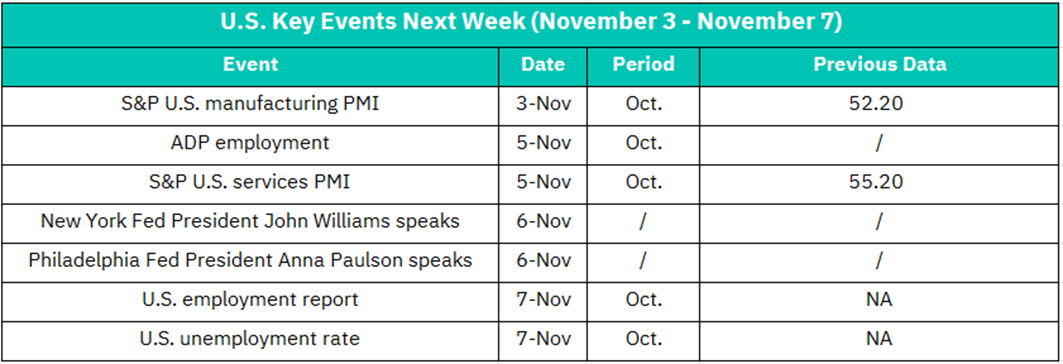
November 3:
S&P U.S. Manufacturing PMI (October): Previous reading was 52.20, indicating expansion in the manufacturing sector.
Market Impact: The manufacturing PMI will provide crucial insights into the health of the industrial sector. A reading above 50 indicates expansion, and the previous 52.20 suggests moderate growth. If the October data shows improvement, it could boost industrial and cyclical stocks. However, any decline below 50 would signal contraction and potentially weigh on market sentiment, particularly affecting manufacturing, materials, and industrial sectors. This data will also influence Federal Reserve policy expectations.
November 5:
ADP Employment Report (October): Private sector employment data (previous data not available).
S&P U.S. Services PMI (October): Previous reading was 55.20, showing strong expansion in the services sector.
Market Impact: This is a critical day for economic data. The ADP report serves as a preview for the official employment report and will set expectations for labor market strength. A strong reading would support the case for economic resilience but could also maintain pressure on the Fed to keep rates higher. The Services PMI at 55.20 previously indicated robust services sector growth—if this trend continues, it would be positive for the broader market since services comprise the largest portion of the U.S. economy. Strong data could benefit consumer discretionary, financial, and technology services stocks, though it may also support a "higher for longer" interest rate narrative.
November 6:
New York Fed President John Williams speaks
Philadelphia Fed President Anna Paulson speaks
Market Impact: Fed officials' speeches are closely watched for monetary policy signals. Any hawkish commentary suggesting prolonged higher interest rates could pressure equity valuations, particularly growth and technology stocks. Conversely, dovish signals hinting at potential rate cuts could rally markets. The market will scrutinize their views on inflation, economic growth, and the labor market. These speeches could create intraday volatility, especially in rate-sensitive sectors like real estate, utilities, and high-growth technology stocks.
November 7:
U.S. Employment Report (October): The headline jobs report with no previous data available.
U.S. Unemployment Rate (October): The official unemployment rate with no previous data available.
Market Impact: This is the most critical day of the week. The monthly employment report is one of the most important economic indicators, directly influencing Federal Reserve policy decisions. Strong job growth and a low unemployment rate would signal economic strength but could keep the Fed in restrictive mode, potentially pressuring equity markets. Conversely, weaker-than-expected job growth or rising unemployment could spark recession fears, creating immediate market volatility. However, it might also increase expectations for Fed rate cuts, which could support equity valuations. This report will likely drive significant market movements across all sectors, with particular impact on interest rate-sensitive stocks, financial services, and broad market indices. Expect heightened volatility and potentially large intraday swings following the 8:30 AM ET release.
Crypto ETF Technical Analysis:
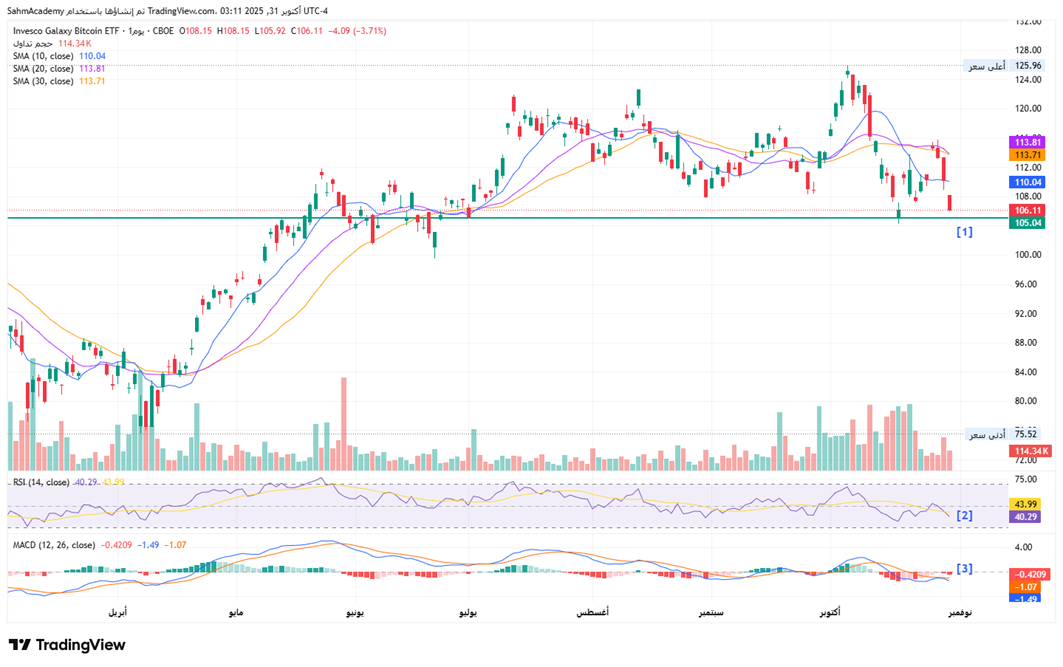
BTCO is currently in a state of technical deterioration following a failed breakout attempt in early October, the price action reveals a critical breakdown below the 20-day and 30-day simple moving averages at 113.81 and 113.71 respectively, with the 10-day SMA at 110.04 now serving as tenuous near-term resistance. The ETF's peak near 125.96 in mid-October was followed by a series of lower highs and lower lows, establishing a clear bearish pattern. [1] Current price sits dangerously near support at 105.04, with a breakdown below this level potentially targeting the 100-104 zone. Volume has remained elevated at 114.34K shares, suggesting institutional distribution rather than capitulation, which is characteristic of a transition from accumulation to distribution phases. The formation resembles a failed bull flag, indicating that momentum buyers have exhausted themselves.
[2] From a momentum perspective, the technical indicators present a decidedly bearish confluence that warrants defensive positioning. The RSI at 40.29 has descended into oversold territory below 50, indicating weakening buying pressure and shifted market psychology from bullish to defensive.
[3] MACD histogram has turned deeply negative at -1.07, with the signal line crossing below the centerline—a textbook bearish crossover that typically precedes further downside.
Unless BTCO can reclaim and hold above 113.81 on above-average volume, the technical structure suggests further deterioration toward 100. Traders should recognize that this ETF's correlation with Bitcoin's price action makes it vulnerable to cryptocurrency sector weakness.
Disclaimer:
Sahm is subject to the supervision and control of the CMA, pursuant to its license no. 22251-25 issued by CMA.
The Information presented above is for information purposes only, which shall not be intended as and does not constitute an offer to sell or solicitation for an offer to buy any securities or financial instrument or any advice or recommendation with respect to such securities or other financial instruments or investments. When making a decision about your investments, you should seek the advice of a professional financial adviser and carefully consider whether such investments are suitable for you in light of your own experience, financial position and investment objectives. The firm and its analysts do not have any material interests or conflicts of interest in any companies mentioned in this report.
Performance data provided is accurate and sourced from reliable platforms, including Argaam, TradingView, MarketWatch.
IN NO EVENT SHALL SAHM CAPITAL FINANCIAL COMPANY BE LIABLE FOR ANY DAMAGES, LOSSES OR LIABILITIES INCLUDING WITHOUT LIMITATION, DIRECT OR INDIRECT, SPECIAL, INCIDENTAL, CONSEQUENTIAL DAMAGES, LOSSES OR LIABILITIES, IN CONNECTION WITH YOUR RELIANCE ON OR USE OR INABILITY TO USE THE INFORMATION PRESENTED ABOVE, EVEN IF YOU ADVISE US OF THE POSSIBILITY OF SUCH DAMAGES, LOSSES OR EXPENSES.