In-Depth Equity Analysis: Broadcom Inc. (AVGO)
Broadcom: Beyond Semiconductors - The Evolution into an AI-Driven Hardware-Software Powerhouse:
1. Broadcom is one of the world's largest semiconductor and infrastructure software solutions providers, primarily offering network chips, storage chips, and wireless communication chips. Through continuous acquisitions in recent years, particularly the acquisition of VMware in 2023, the company has gradually built an integrated hardware and software business model.
Recently, its AI business has experienced rapid growth, driving a surge in stock prices. The company's current market value has exceeded $1 trillion, making it one of the most sought-after AI companies in the market after NVIDIA.
2. Broadcom's core business is divided into two main segments: semiconductor solutions and infrastructure software. The semiconductor segment includes various product lines such as networking chips, storage chips, wireless communication chips, custom ASICs, and broadband solutions. This is Broadcom's most crucial business, generating revenue of $28.2 billion in fiscal 2023, accounting for approximately 80% of total revenue.
The software segment includes security software, distributed software, and mainframe software solutions. The acquisition of VMware in 2023 was a milestone event that significantly boosted the software business growth. As a result, the software segment has grown rapidly, accounting for approximately 40% of total revenue in the first half of fiscal 2024.
3. Looking at specific product segments, Broadcom's semiconductor solutions have broad downstream applications, including TV set-top boxes, data centers, wearable devices, and enterprise servers. The company is the absolute leader in Ethernet switching chips.
Additionally, ASIC chips have recently gained significant attention from capital markets. Compared to GPU chips, ASICs are customized chips that can substantially reduce computing costs. These application-specific integrated circuits are designed for particular purposes, making them more efficient than general-purpose processors like GPUs for specific tasks.
4. Broadcom's software business primarily serves the enterprise IT infrastructure sector, with its main customers including large enterprises, government agencies, financial institutions, and manufacturers. The software segment maintains a significantly higher gross margin of nearly 90%.
Investment Thesis:
1. Broadcom is one of the few companies in the market that integrates both hardware and software capabilities. Its downstream products have wide applications and hold high market share in most segments. The company supplies to leading tech companies and demonstrates strong product capabilities.
2. The software business has become a second growth curve for Broadcom. Through continuous acquisitions, Broadcom has significantly strengthened its software business positioning. The software segment's growth rate notably exceeds that of hardware. In Q4, software revenue grew 196% year-over-year to $5.82 billion. Additionally, the software business maintains higher gross margins, and as it transitions towards a SaaS business model, it will generate more stable long-term cash flows and command higher valuations.
3. AI business opens up new possibilities. Broadcom estimates that by fiscal year 2027, the market potential for AI components in data centers will reach $90 billion. This suggests that in the AI chip sector, ASIC growth will significantly outpace GPU chips. Broadcom has the potential to become a challenger to NVIDIA, leading investors to speculate whether Broadcom will replicate NVIDIA's success story.
4. Typically, continuous acquisitions raise investor concerns about goodwill impairment risks. However, looking at historical performance, Broadcom's acquisition track record has been largely successful. Most of its acquisitions have enhanced the company's core competitiveness in the long term and improved its financial performance.
Valuation Analysis:
1. From a P/E perspective, the trailing twelve months (TTM) P/E ratio has exceeded 180x, significantly higher than competitors like NVIDIA. Compared to its own historical valuations, the current level is near its most expensive range. The market's enthusiasm for Broadcom has, to some extent, overdrawn its future upside potential.
2. Given Broadcom's gradually increasing software business proportion, the Price-to-Sales (P/S) ratio can also be used as a reference valuation metric. Currently, the P/S ratio exceeds 20x, which represents a relatively high figure both within the industry and compared to its own historical levels.
Financial Analysis:
1. Q4 revenue totaled $14.1 billion, up 51.2% year-over-year, largely meeting expectations. Non-GAAP net profit reached $6.97 billion, increasing 44.8% compared to the same period last year. Gross margin was 76.9%, showing an improvement of 8 percentage points year-over-year.
2. AI business showed strong performance, with Q4 AI revenue reaching $3.7 billion, representing a 150% year-over-year growth. Regarding guidance, Q1 2025 revenue is expected to grow 21.7% year-over-year to $14.6 billion, generally in line with market expectations.
3. For the full fiscal year, revenue increased 44% year-over-year to a record high of $51.6 billion, with AI revenue growing 220% year-over-year to $12.2 billion.
4. Benefiting from continued expansion in tech companies' capital expenditure, the company's AI-related Serviceable Addressable Market is expected to reach $60-90 billion. The core rationale is that large enterprises are seeking alternatives to NVIDIA's GPU chips.
Technical Analysis:
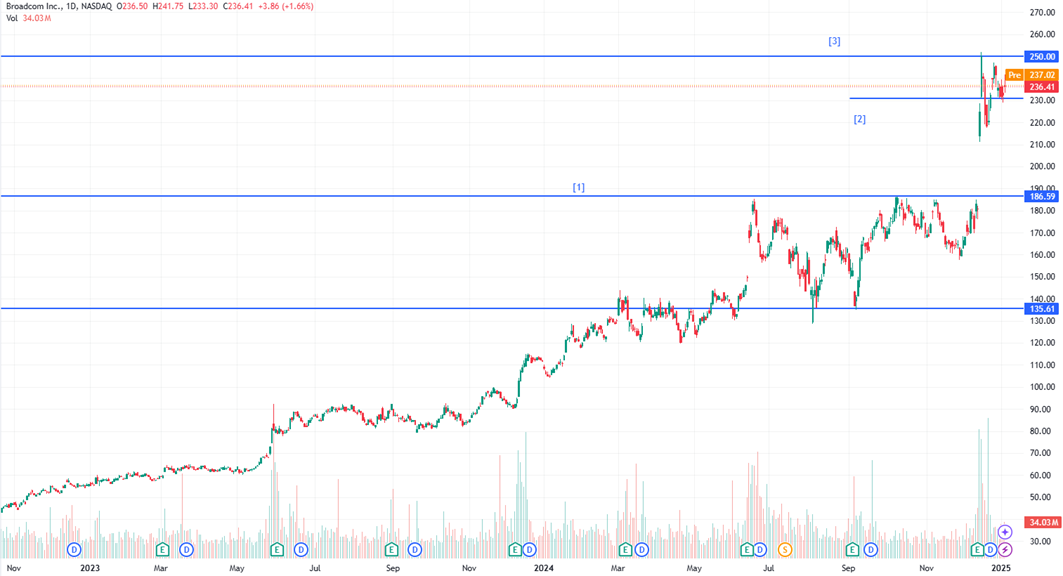
Since early 2023, the stock has shown a clear upward trend. From mid-2024 to late 2024, it formed a consolidation range[1]. In December 2024, the stock accelerated upward, primarily due to better-than-expected earnings, creating a significant gap up from a technical perspective.
After consecutive highs, the stock formed a narrow consolidation zone. Currently, this consolidation range is gradually converging, making it more challenging to buy low and sell high. Notably, the trading volume surged at the peak, indicating potential selling pressure from profit-taking.
The short-term support level is around $230[2], while the high of $250, reached with high volume, represents a significant resistance level[3]. If the price fails to break above $250 consistently, it's advisable to monitor the $230 level. Should the price break below $230, it might fill the gap, which could present a good opportunity to establish positions.
[1] Trading Range (Box Pattern): A period where a stock price moves sideways between consistent upper and lower boundaries.
[2] Support Level: A price level where downward movement typically stops as buying interest increases, acting like a floor.
[3] Resistance Level: A price level where upward movement typically stops as selling pressure increases, acting like a ceiling.
Risk Factors:
1. Risk of underperforming macroeconomic conditions: If the global economy underperforms in 2025, major tech companies might reduce capital expenditure, leading to lower-than-expected demand for Broadcom's products.
2. ASIC chip development risk: Currently, the market is optimistic about ASIC's potential growth rate. If ASIC development falls short of expectations or lags behind GPUs, this will negatively impact Broadcom's high valuation.
3. Financial risk: Broadcom's numerous acquisitions have resulted in significant goodwill and debt, which could put pressure on the company's operations.
Research Report Appendix
Company Concept:
Broadcom is one of the world's largest semiconductor and infrastructure software solutions providers, primarily offering network chips, storage chips, and wireless communication chips. Through continuous acquisitions in recent years, particularly the acquisition of VMware in 2023, the company has gradually built an integrated hardware and software business model.
Model Explanation:
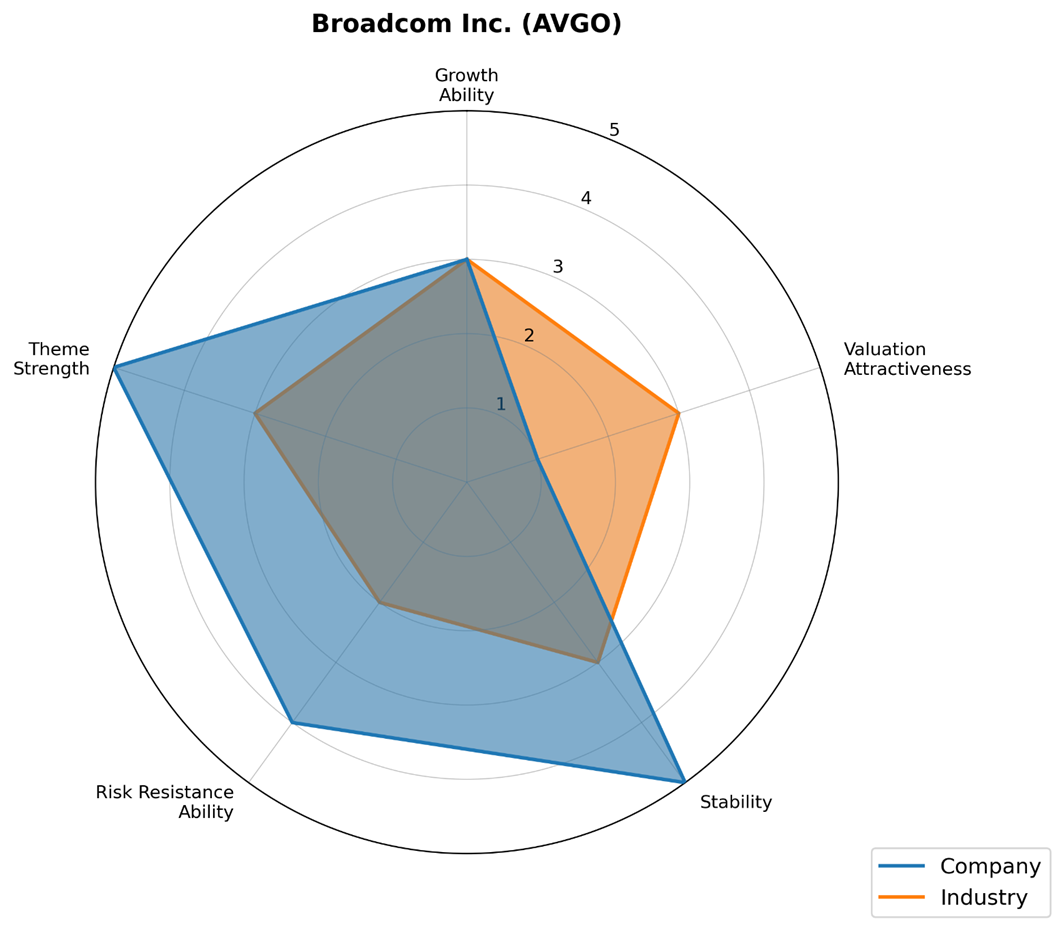
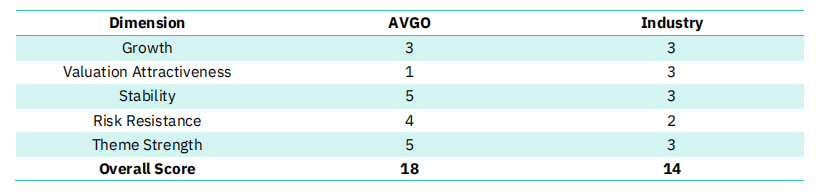
The model primarily evaluates companies and industries across five dimensions: growth ability, valuation attractiveness, stability, risk resistance ability, and theme strength. Each dimension is scored from 1-5, with 1 being the lowest and 5 the highest. Overall, higher scores indicate stronger fundamentals. For each dimension, a multi-factor model will be constructed based on industry and historical data of selected stocks, and a quantitative model will be used to automatically score each dimension.
Here are the dimensions explained:
- Growth Ability: Measures future performance potential; higher growth rates yield higher scores.
- Valuation Attractiveness: Assesses stock valuation; lower valuations earn higher scores.
- Stability: Evaluates the consistency of profit generation; greater stability means higher scores.
- Risk Resistance: Gauges the capacity to endure macroeconomic changes; better risk resistance leads to higher scores.
- Theme Strength: Rates market favor for the stock in the short term; increased favor results in higher scores.
Disclaimer:
The Information presented above is for information purposes only, which shall not be intended as and does not constitute an offer to sell or solicitation for an offer to buy any securities or financial instrument or any advice or recommendation with respect to such securities or other financial instruments or investments. When making a decision about your investments, you should seek the advice of a professional financial adviser and carefully consider whether such investments are suitable for you in light of your own experience, financial position and investment objectives. The firm and its analysts do not have any material interest or conflict of interest with any stocks mentioned in this report.
IN NO EVENT SHALL SAHM CAPITAL FINANCIAL COMPANY BE LIABLE FOR ANY DAMAGES, LOSSES OR LIABILITIES INCLUDING WITHOUT LIMITATION, DIRECT OR INDIRECT, SPECIAL, INCIDENTAL, CONSEQUENTIAL DAMAGES, LOSSES OR LIABILITIES, IN CONNECTION WITH YOUR RELIANCE ON OR USE OR INABILITY TO USE THE INFORMATION PRESENTED ABOVE, EVEN IF YOU ADVISE US OF THE POSSIBILITY OF SUCH DAMAGES, LOSSES OR EXPENSES.