

A Look At Avista (AVA) Valuation As Recent Share Price Moves Draw Investor Attention
Avista Corporation AVA | 0.00 |
Avista (AVA) is on investors’ radar after recent share price moves, with the stock last closing at $41.50. That puts the company’s market value around $3.4b, anchoring any assessment of its current valuation.
Recent moves sit within a steadier trend, with a 90 day share price return of 2.19% and a year to date share price return of 7.18% alongside a 1 year total shareholder return of 12.27%. This points to gradually building momentum rather than a sharp re rating.
If you are weighing Avista against other opportunities in the power and grid space, this is a good moment to scan 35 power grid technology and infrastructure stocks
With the stock trading close to its US$41.83 analyst price target and intrinsic value estimates pointing to a premium, the key question is whether Avista still offers upside or whether the market is already pricing in future growth.
Most Popular Narrative: 3% Undervalued
Avista’s most followed narrative pegs fair value at $42.80, a touch above the $41.50 last close, framing the stock as modestly undervalued.
Robust, multi-year capital investment plans approaching $3 billion (2025–2029), with additional upside from grid expansion projects and new generation needs tied to large load requests, position Avista to earn regulated returns and drive long-term earnings expansion. Approval of favorable, all-party rate settlements in Oregon and Idaho, alongside established constructive regulatory outcomes in Washington, increases predictability and supports improved future net margins and stable earnings through rate recovery.
Curious what justifies a higher fair value than today’s price? The narrative leans heavily on steady revenue growth, rising margins, and a richer future earnings multiple. The full story comes from how these moving parts are stitched together, not any single forecast.
Result: Fair Value of $42.80 (UNDERVALUED)
However, there is still meaningful risk that higher wildfire mitigation and grid modernization costs, as well as tougher rate case outcomes, could squeeze returns and undercut this modest undervaluation story.
Another View: Cash Flows Paint a Tougher Picture
While the popular narrative has Avista at around 3% undervalued with a fair value of $42.80, our DCF model points the other way. On this measure, the stock trades at $41.50 versus an estimated future cash flow value of $35.94, suggesting it is overvalued.
When one approach signals modest upside and another shows a cash flow gap, which lens do you trust most for your own thesis on Avista?
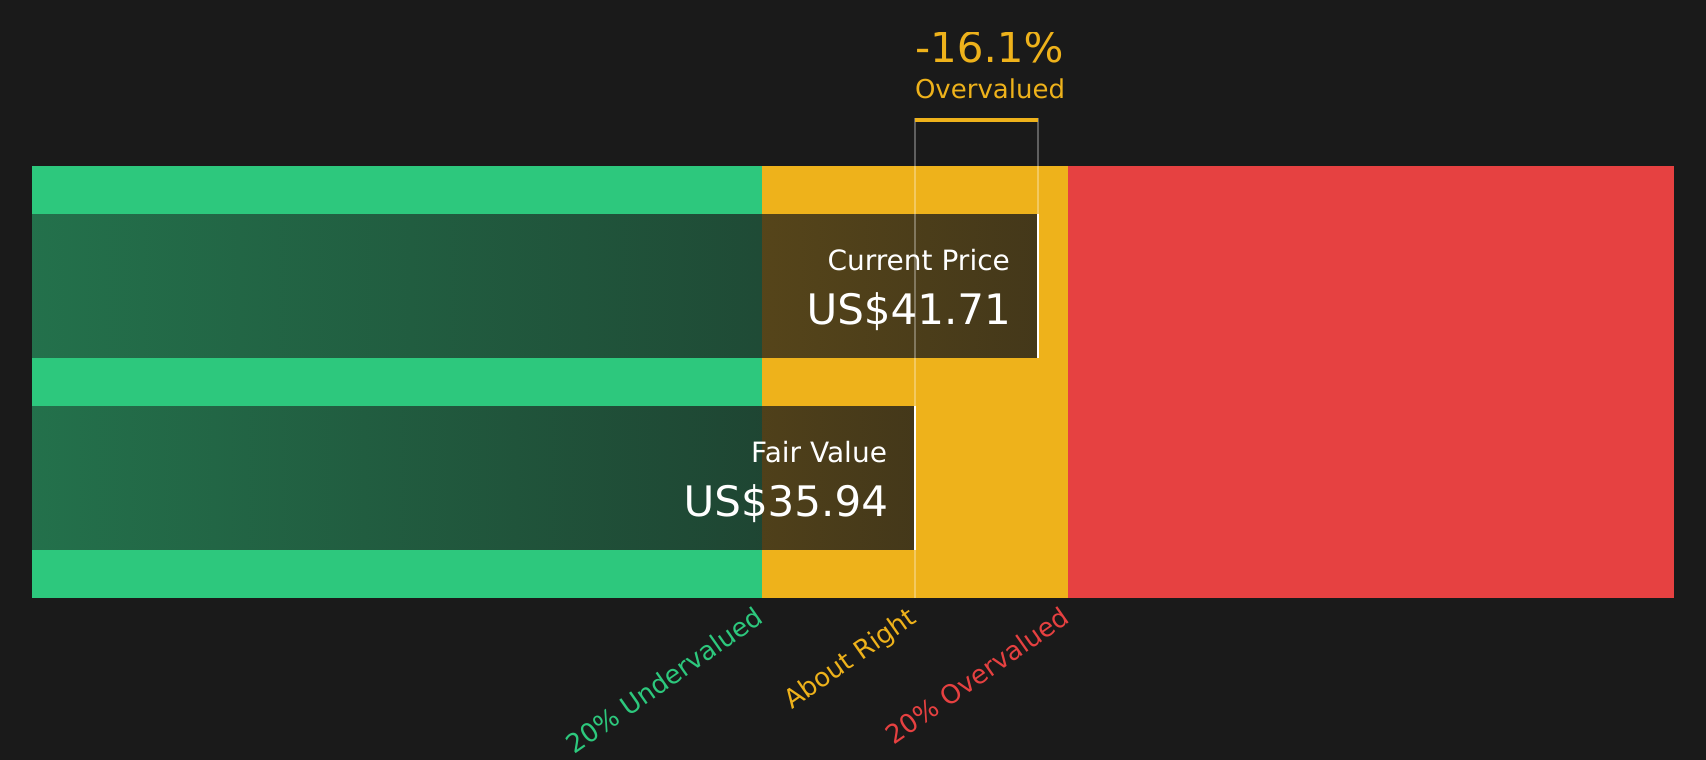
Simply Wall St performs a discounted cash flow (DCF) on every stock in the world every day (check out Avista for example). We show the entire calculation in full. You can track the result in your watchlist or portfolio and be alerted when this changes, or use our stock screener to discover 46 high quality undervalued stocks. If you save a screener we even alert you when new companies match - so you never miss a potential opportunity.
Next Steps
With mixed signals on valuation and both risks and rewards in play, this is the moment to review the data yourself and decide how you feel about Avista’s balance of upside and downside using 4 key rewards and 2 important warning signs.
Looking for more investment ideas?
If Avista is only one part of your watchlist, do not stop here. Broaden your options and let the data surface fresh ideas for your next move.
- Target resilient income by reviewing companies in the 10 dividend fortresses that may align with a long term, cash focused approach.
- Hunt for potential bargains using the 46 high quality undervalued stocks to see which stocks currently trade below their assessed worth on key fundamentals.
- Spot opportunities others might be overlooking by scanning the screener containing 22 high quality undiscovered gems before they draw wider attention.
This article by Simply Wall St is general in nature. We provide commentary based on historical data and analyst forecasts only using an unbiased methodology and our articles are not intended to be financial advice. It does not constitute a recommendation to buy or sell any stock, and does not take account of your objectives, or your financial situation. We aim to bring you long-term focused analysis driven by fundamental data. Note that our analysis may not factor in the latest price-sensitive company announcements or qualitative material. Simply Wall St has no position in any stocks mentioned.