A Look At CBRE Group (CBRE) Valuation As Technical Momentum Draws Renewed Investor Interest
CBRE Group, Inc. Class A CBRE | 147.80 | +0.22% |
Recent technical work on CBRE Group (CBRE) has put the stock in focus, with a strong uptrend, high momentum, and sector outperformance drawing investors toward the chart rather than the fundamentals.
At a share price of $166.18, CBRE has seen short term pressure, including a 7 day share price return decline of 3.16%, while longer term momentum remains positive, reflected in a 1 year total shareholder return of 14.94% and 5 year total shareholder return of 136.22%.
If this renewed interest in CBRE has you thinking more broadly about real asset exposure, it could be a good moment to check out 21 elite gold producer stocks identified by our screener as another way to diversify.
With CBRE trading at $166.18, showing solid long term returns but a value score of 0 and an intrinsic value estimate that sits above the current price, you have to ask: is this a genuine opportunity, or is the market already pricing in future growth?
Most Popular Narrative: 10.1% Undervalued
Against CBRE Group's last close of $166.18, the most followed narrative points to a fair value estimate of about $184.83, which frames the current technical strength against a higher long term valuation anchor.
Continued investments in high demand sectors such as data centers and strategic geographic markets, alongside capital deployment in share repurchases and M&A, are expected to deliver long term EPS growth and shareholder value, leveraging favorable market conditions and strategic positioning.
Curious what earnings path and margin profile sit behind that fair value gap. The narrative focuses on steady revenue expansion, higher margins, and a richer future earnings multiple. This helps clarify how those elements may fit together and what they could imply for CBRE's longer term cash generation and valuation profile.
Result: Fair Value of $184.83 (UNDERVALUED)
However, the picture could change quickly if interest rate volatility pressures real estate transactions or if large leasing activity slows more than analysts currently expect.
Another View: What The P/E Ratio Is Saying
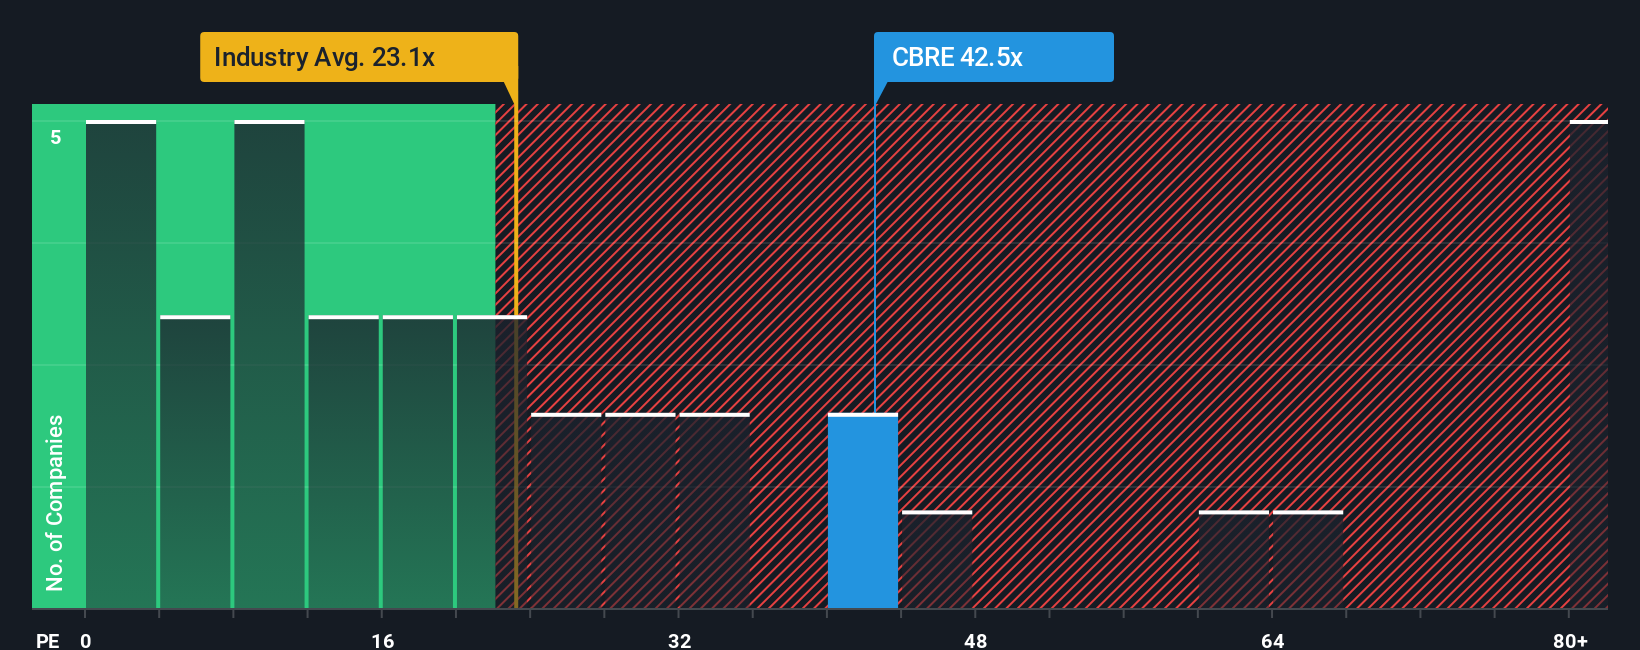
While the narrative fair value of $184.83 suggests upside from $166.18, the P/E ratio tells a tighter story. CBRE trades at 39.7x earnings, compared with a fair ratio of 31x, the US real estate industry at 28.5x, and peers at 27.9x. That richer multiple could leave less room if expectations are tested, or it could signal that investors are already paying up for quality. Which side of that trade do you feel more comfortable on?
Build Your Own CBRE Group Narrative
If you see the story differently or prefer to work from the raw numbers yourself, you can build a custom CBRE view in minutes by starting with Do it your way.
A great starting point for your CBRE Group research is our analysis highlighting 2 key rewards and 1 important warning sign that could impact your investment decision.
Looking for more investment ideas?
If CBRE has sharpened your focus, do not stop here. These screeners can surface opportunities you might wish you had found earlier.
- Spot potential mispricings by reviewing 55 high quality undervalued stocks that pair quality fundamentals with what our models flag as attractive entry points.
- Strengthen your income watchlist by checking out 15 dividend fortresses that combine higher yields with a focus on resilience.
- Protect your downside by scanning 80 resilient stocks with low risk scores that score well on our risk framework and balance sheet checks.
This article by Simply Wall St is general in nature. We provide commentary based on historical data and analyst forecasts only using an unbiased methodology and our articles are not intended to be financial advice. It does not constitute a recommendation to buy or sell any stock, and does not take account of your objectives, or your financial situation. We aim to bring you long-term focused analysis driven by fundamental data. Note that our analysis may not factor in the latest price-sensitive company announcements or qualitative material. Simply Wall St has no position in any stocks mentioned.