A Look At Cheniere Energy Partners (CQP) Valuation After Board And Executive Committee Changes
Cheniere Energy Partners, L.P. CQP | 62.95 | -0.88% |
Cheniere Energy Partners (CQP) has drawn fresh attention after appointing Matthew Runkle to the board of its general partner and executive committee, with Scott Peak resigning. This leadership shift was closely flagged in an SEC filing.
At a share price of $65.95, Cheniere Energy Partners has seen firm momentum, with a 24.43% 90 day share price return and a 5 year total shareholder return of 123.78%. This points to sustained investor interest around developments such as this board change.
If this leadership update has you reviewing your energy exposure, it could also be a useful moment to look across related infrastructure opportunities using the 28 power grid technology and infrastructure stocks
After a strong run over the past year and solid multi year total returns, plus analyst targets that sit below the current US$65.95 price, the key question is whether CQP is now fully valued or if markets are still underpricing its future growth potential.
Price-to-Earnings of 12.7x: Is it justified?
Cheniere Energy Partners is trading on a P/E of 12.7x, and at a last close of $65.95 that multiple screens as inexpensive compared with both peers and the wider US market.
The P/E ratio compares the current share price to earnings per unit, so for a business like CQP that already generates meaningful profits, it gives a quick read on how much investors are paying for each dollar of earnings. A lower P/E can sometimes mean the market expects weaker profit trends, but it can also flag situations where earnings strength is not fully reflected in the price.
For CQP, the P/E of 12.7x sits below the US Oil and Gas industry average of 15.6x and also below the peer group average of 18x. This highlights a clear gap in how the market is pricing its earnings compared with similar companies. It also stands below an estimated fair P/E of 20.5x, suggesting the current level is well under the ratio that historical patterns indicate the market could move towards if sentiment and fundamentals remained aligned.
Result: Price-to-Earnings of 12.7x (UNDERVALUED)
However, still keep in mind that an annual net income decline of 3.07% and analyst targets below the current price could both challenge the case for a higher P/E.
Another View: DCF Points the Other Way
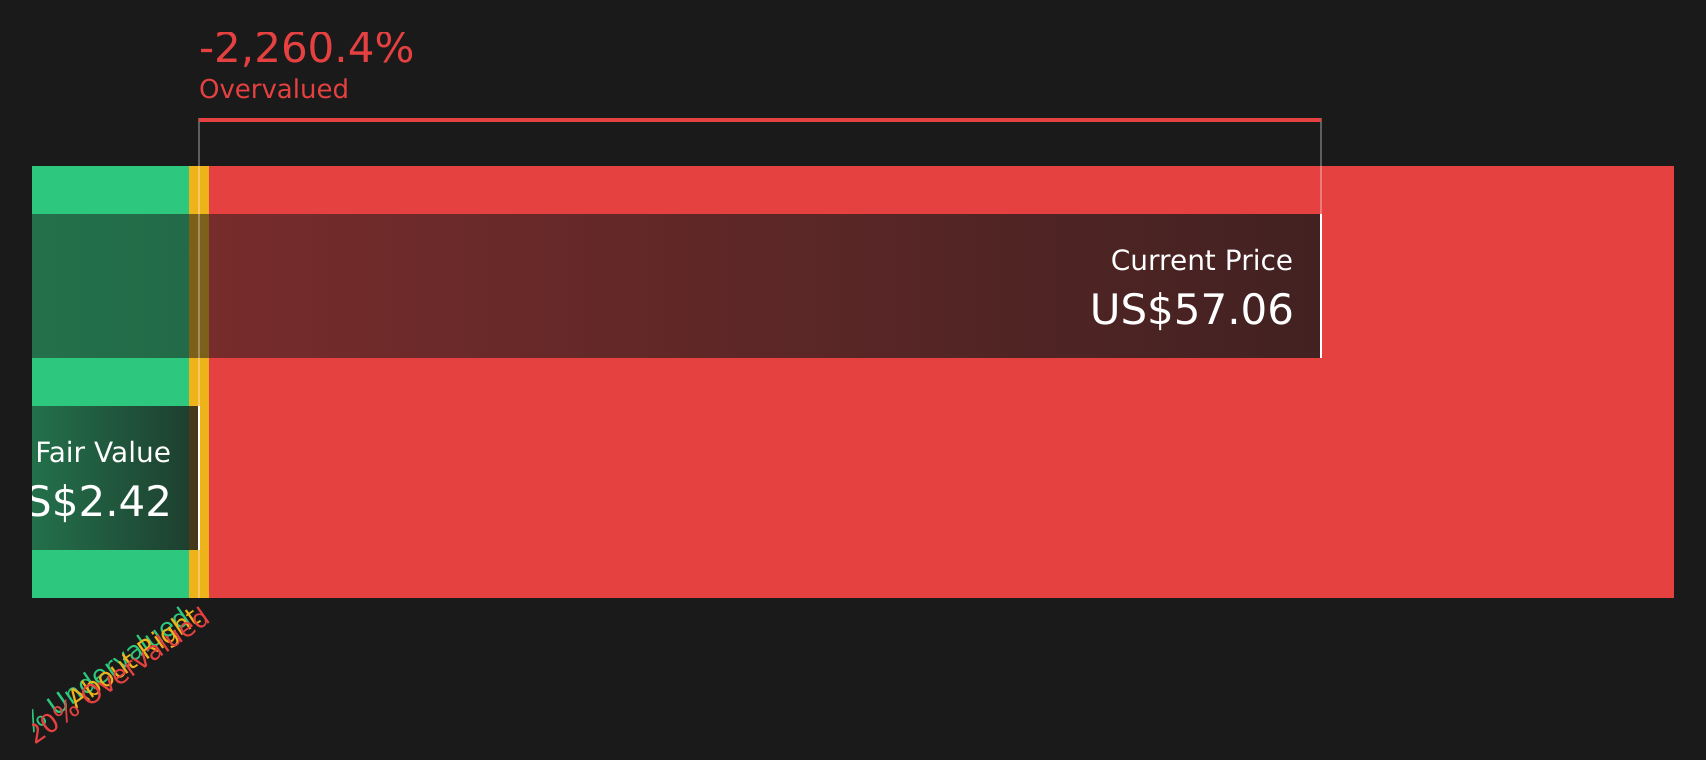
While the 12.7x P/E suggests CQP could be inexpensive, the SWS DCF model tells a different story. On this view, the current $65.95 price sits well above an estimated future cash flow value of $2.45, which screens as overvalued and raises questions about how secure the current premium really is.
For investors, the contrast between earnings based value and cash flow based value is a reminder to stress test any thesis against more than one lens, especially when they point in opposite directions.
Simply Wall St performs a discounted cash flow (DCF) on every stock in the world every day (check out Cheniere Energy Partners for example). We show the entire calculation in full. You can track the result in your watchlist or portfolio and be alerted when this changes, or use our stock screener to discover 61 high quality undervalued stocks. If you save a screener we even alert you when new companies match - so you never miss a potential opportunity.
Next Steps
Mixed messages on value and future potential can make CQP tricky to interpret, so consider acting promptly, reviewing the numbers yourself and weighing up the 3 key rewards and 3 important warning signs
Looking for more investment ideas?
If CQP is already on your radar, do not stop there. Broaden your watchlist with other focused ideas that could sharpen your overall portfolio decisions.
- Target potential mispricing opportunities by scanning a curated set of companies that currently look inexpensive on quality and value metrics using the 61 high quality undervalued stocks.
- Strengthen your income stream by checking companies that combine higher yields with resilient profiles through the 13 dividend fortresses.
- Prioritize resilience by reviewing companies that show lower risk scores and steadier characteristics using the 70 resilient stocks with low risk scores.
This article by Simply Wall St is general in nature. We provide commentary based on historical data and analyst forecasts only using an unbiased methodology and our articles are not intended to be financial advice. It does not constitute a recommendation to buy or sell any stock, and does not take account of your objectives, or your financial situation. We aim to bring you long-term focused analysis driven by fundamental data. Note that our analysis may not factor in the latest price-sensitive company announcements or qualitative material. Simply Wall St has no position in any stocks mentioned.