A Look At Cheniere Energy Partners (CQP) Valuation After Earnings And Reaffirmed Distribution Guidance
Cheniere Energy Partners, L.P. CQP | 0.00 |
Why Cheniere Energy Partners (CQP) is in focus after earnings and distribution update
Cheniere Energy Partners (CQP) is back on investors' radar after reaffirming its 2026 distribution guidance of $3.10 to $3.40 per common unit and reporting mixed first quarter 2026 results.
The recent pullback, with a 7 day share price return of down 5.58%, comes after the earnings and distribution update. By contrast, the 90 day share price return of 8.18% and 1 year total shareholder return of 12.73% reflect momentum built over a longer stretch.
If you are weighing income ideas like CQP alongside potential growth stories, it can be useful to compare with other areas of the market such as 37 power grid technology and infrastructure stocks
With revenue and net income moving in different directions and the current unit price sitting above the latest analyst target, the key question is whether CQP is undervalued for its income profile or whether the market is already pricing in future growth.
Preferred P/E of 14.8x: Is it justified?
CQP trades on a P/E of 14.8x, with the last close at $62.57. This suggests the market is putting a moderate earnings multiple on the stock compared with both the wider US market and its own peers.
The P/E multiple compares the current unit price to earnings per unit. It gives you a quick sense of how much investors are paying for each dollar of profits. For a capital intensive LNG infrastructure business like CQP, this can be a useful way to think about how the market views its earnings profile and long term contracts.
CQP screens as good value versus the estimated fair P/E of 22.4x and the US market average of 19x. This comparison suggests the current multiple could move closer to levels the SWS fair ratio points to if conditions remain similar. However, the P/E sits slightly above the US Oil and Gas industry average of 14.2x, which indicates investors are already paying a small premium to the sector for CQP’s earnings quality and growth record.
Result: Price-to-earnings of 14.8x (ABOUT RIGHT)
However, the 4.3% premium to the latest analyst target and modest annual revenue and net income growth could limit upside if contract or regulatory conditions soften.
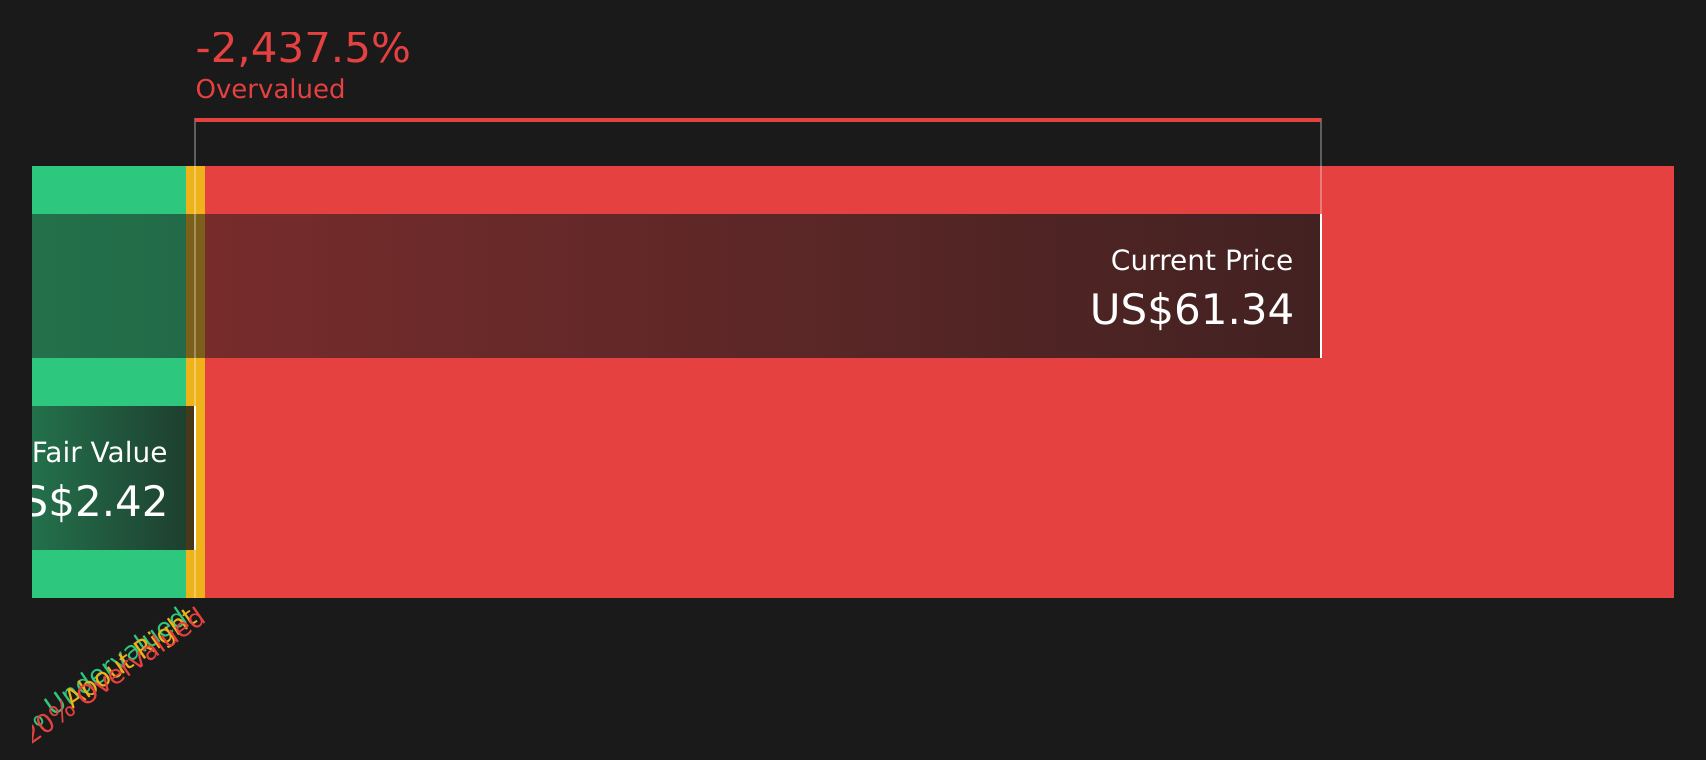
Another View: DCF sends a very different message
While the P/E comparison makes CQP look reasonably priced, the SWS DCF model paints a sharply different picture. With the unit price at $62.57 and the estimated future cash flow value at $2.42, this model points to CQP trading well above its implied value. Which lens do you trust more when cash flows matter most?
Simply Wall St performs a discounted cash flow (DCF) on every stock in the world every day (check out Cheniere Energy Partners for example). We show the entire calculation in full. You can track the result in your watchlist or portfolio and be alerted when this changes, or use our stock screener to discover 44 high quality undervalued stocks. If you save a screener we even alert you when new companies match - so you never miss a potential opportunity.
Next Steps
Uncertain whether the mixed signals in this article lean positive or cautious overall? Take a closer look at the data now and shape your own view with 2 key rewards and 2 important warning signs
Looking for more investment ideas?
Do not stop with a single stock when the next opportunity could already be on your radar. Use filters that match your style and let the data do the heavy lifting.
- Target dependable income by scanning companies that feature 13 dividend fortresses and see which ones align with your payout expectations.
- Spot potential bargains early by checking stocks surfaced in the 44 high quality undervalued stocks and compare how their fundamentals stack up.
- Prioritise resilience by focusing on companies highlighted in the 69 resilient stocks with low risk scores to see which businesses may better match your risk comfort.
This article by Simply Wall St is general in nature. We provide commentary based on historical data and analyst forecasts only using an unbiased methodology and our articles are not intended to be financial advice. It does not constitute a recommendation to buy or sell any stock, and does not take account of your objectives, or your financial situation. We aim to bring you long-term focused analysis driven by fundamental data. Note that our analysis may not factor in the latest price-sensitive company announcements or qualitative material. Simply Wall St has no position in any stocks mentioned.