A Look At Core & Main (CNM) Valuation As Earnings Approach After Long-Term Growth And Expanding Margins
Core & Main, Inc. Class A CNM | 0.00 |
Upcoming earnings put Core & Main in focus
Core & Main (CNM) heads into its June 10 earnings report after 16 consecutive years of sales growth, recent margin expansion, and a 2.85% gain in the latest session versus the S&P 500.
Recent trading shows mixed momentum, with a 6.8% 1 month share price return and a 5.1% 3 month share price return, while total shareholder return over the past year declined 12.3% but remains strongly positive over three years.
If Core & Main's water infrastructure focus has your attention, it may be a good time to broaden your search and check out 33 power grid technology and infrastructure stocks
With CNM trading at $52.37, a roughly 16% gap to the average analyst price target and an intrinsic value estimate that sits above the current share price, you have to ask: is there a genuine opportunity here, or is the market already pricing in future growth?
Most Popular Narrative: 13.5% Undervalued
At $52.37, Core & Main trades below a widely followed fair value estimate of $60.56. This puts the focus squarely on what is driving that gap.
Core & Main's strategy includes significant expansion efforts, such as opening new locations and acquiring complementary businesses, contributing to a wider geographical reach and product offering, which may enhance future revenue growth.
To understand the context behind that growth story and fair value, the narrative highlights revenue compounding, margin uplift and a richer earnings mix over time.
Result: Fair Value of $60.56 (UNDERVALUED)
However, you also need to weigh up the possibility that higher interest costs and any slowdown in construction activity could pressure sales, margins and the current earnings narrative.
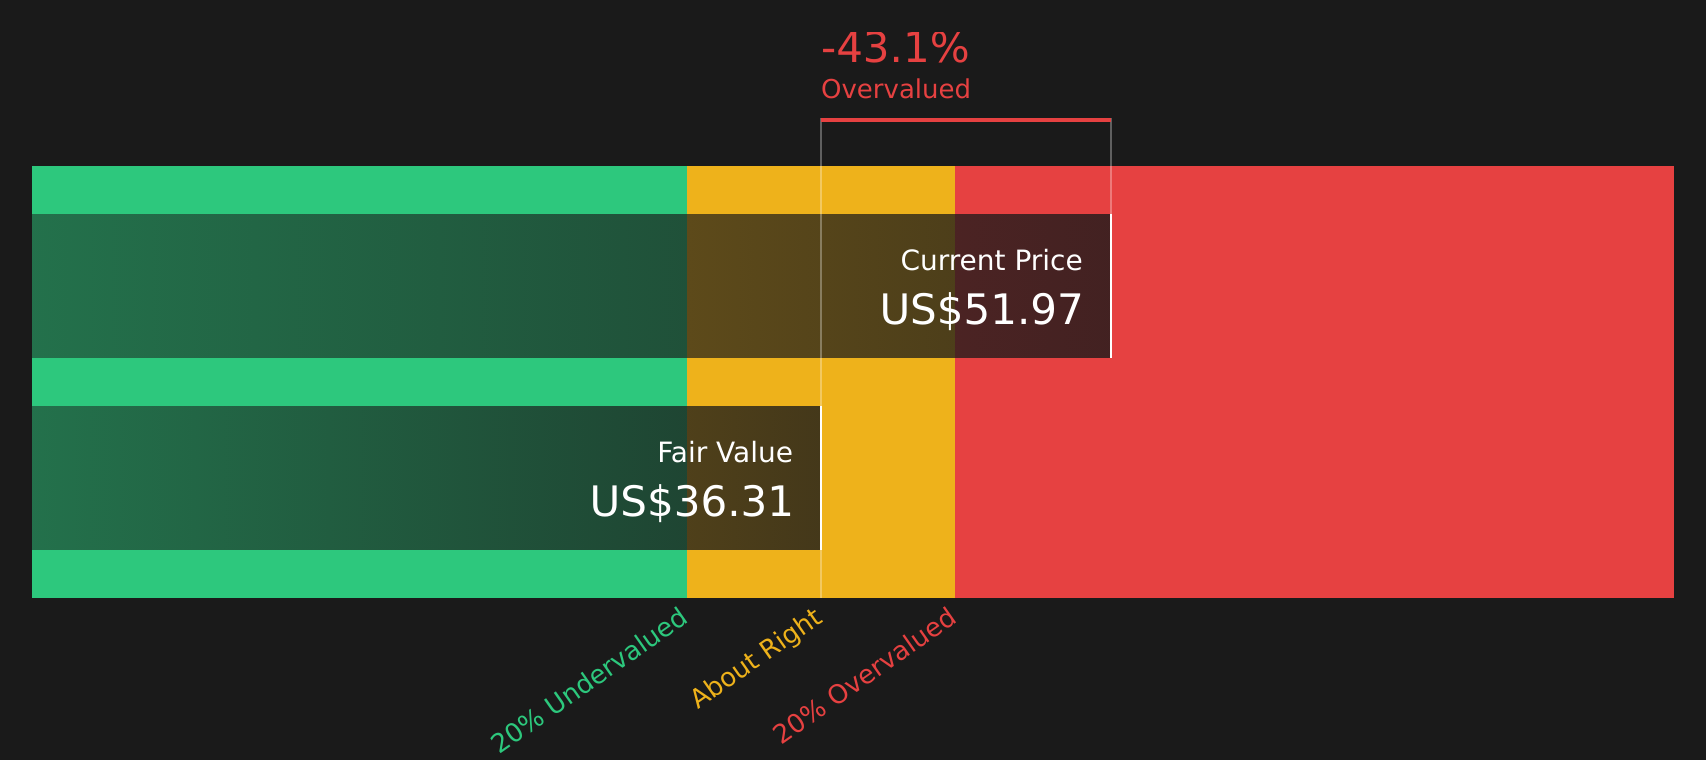
Another View: Cash Flows Tell a Tougher Story
While earnings based valuation points to upside for Core & Main, the SWS DCF model paints a different picture. On that cash flow view, CNM at $52.37 sits above an estimated value of $36.36, which suggests the stock screens as overvalued using this method. Which lens do you trust more for your own thesis?
For a closer look at how sensitive this outcome is to the long term cash flow assumptions and discount rate used, Look into how the SWS DCF model arrives at its fair value.
Simply Wall St performs a discounted cash flow (DCF) on every stock in the world every day (check out Core & Main for example). We show the entire calculation in full. You can track the result in your watchlist or portfolio and be alerted when this changes, or use our stock screener to discover 47 high quality undervalued stocks. If you save a screener we even alert you when new companies match - so you never miss a potential opportunity.
Next Steps
With mixed signals on value and expectations, it makes sense to look through the numbers yourself and see which story you believe. Then weigh those findings against 4 key rewards and 1 important warning sign
Looking for more investment ideas?
If you stop at one stock, you risk missing better fits for your goals, so take a few minutes to scan wider opportunities that might suit your portfolio.
- Spot potential turnaround stories by reviewing 24 elite penny stocks with strong financials that already show stronger financials than many investors expect.
- Target value focused opportunities by checking 47 high quality undervalued stocks that pair solid fundamentals with prices that sit below their estimated worth.
- Prioritise resilience by scanning 65 resilient stocks with low risk scores designed for investors who want steadier companies with lower overall risk profiles.
This article by Simply Wall St is general in nature. We provide commentary based on historical data and analyst forecasts only using an unbiased methodology and our articles are not intended to be financial advice. It does not constitute a recommendation to buy or sell any stock, and does not take account of your objectives, or your financial situation. We aim to bring you long-term focused analysis driven by fundamental data. Note that our analysis may not factor in the latest price-sensitive company announcements or qualitative material. Simply Wall St has no position in any stocks mentioned.