A Look At Dorchester Minerals (DMLP) Valuation As P/E And Cash Flow Signals Conflict
Dorchester Minerals, L.P. DMLP | 0.00 |
What recent performance says about Dorchester Minerals
Dorchester Minerals (DMLP) has seen a 0.1% decline over the past day and a 6.8% pullback over the past week. Its return over the past 3 months stands at 6.3%, and its year-to-date performance is 12.2%.
With the share price at $26.08, Dorchester Minerals has experienced short term share price pressure over the past month. However, longer term total shareholder returns over 3 and 5 years remain positive, indicating that recent momentum has cooled even as longer term holders have still seen gains.
If recent moves in Dorchester Minerals have you reassessing the energy space, it could be a good moment to see what else is out there and review 31 elite gold producer stocks
With Dorchester Minerals trading at $26.08 and an intrinsic discount estimate of about 60%, the key question is whether this royalty-focused energy stock is trading below its underlying value or if the market already reflects its future potential.
Preferred P/E of 18.9x: Is it justified?
Dorchester Minerals trades on a P/E of 18.9x compared with a peer average of 12.9x and a US Oil and Gas industry average of 13.9x, so the stock currently looks expensive relative to both peers and its sector at the last close of $26.08.
The P/E ratio compares the share price to earnings per share and is a quick way to gauge how much investors are paying for each dollar of current earnings. For a royalty focused energy partnership like Dorchester Minerals, that matters because earnings are closely tied to commodity price cycles and production volumes across its mineral and royalty interests.
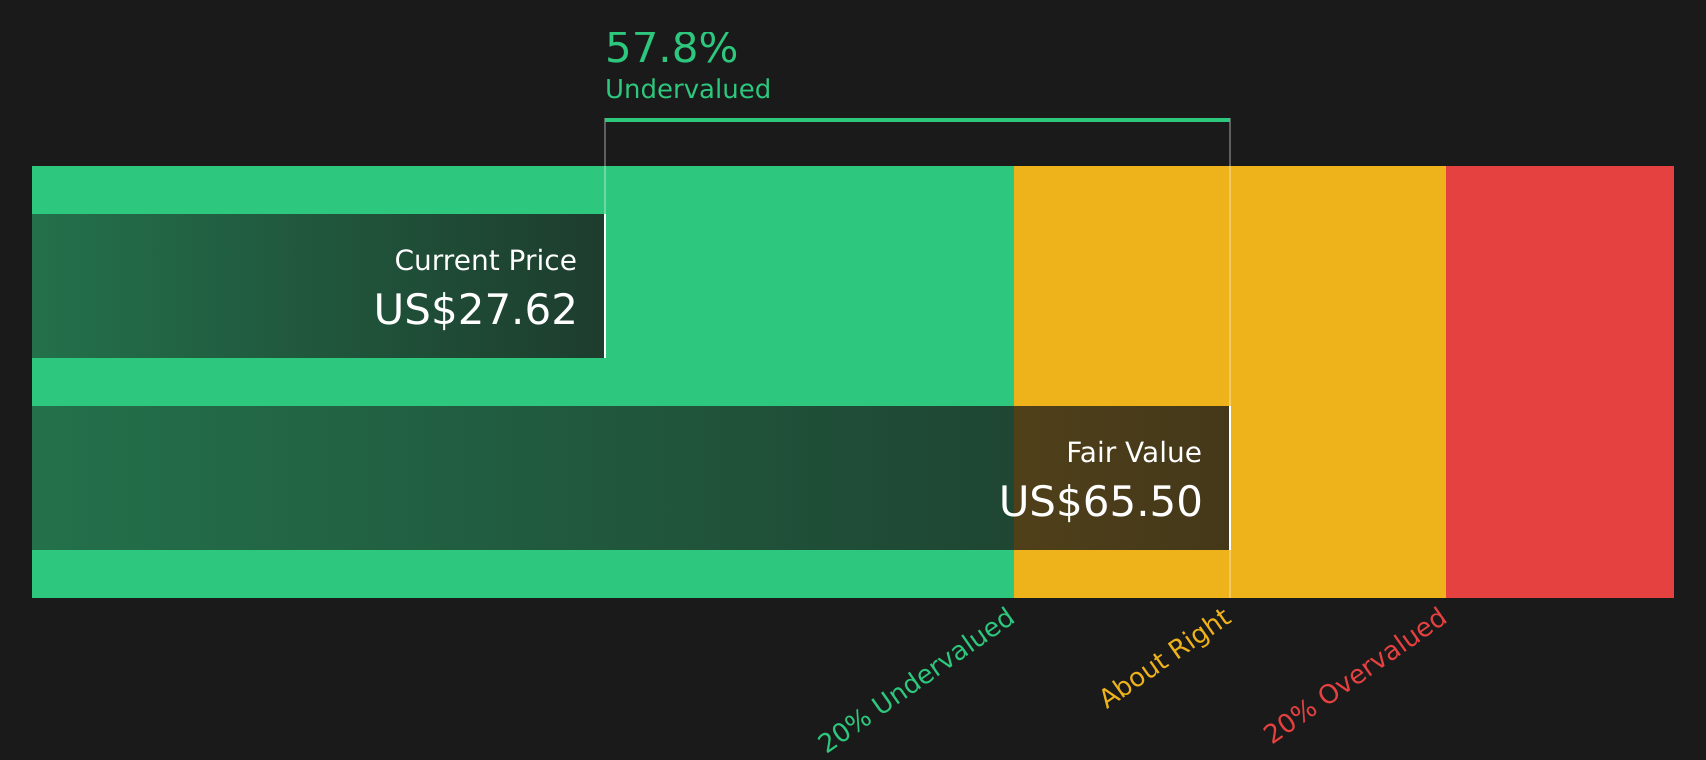
With DMLP also trading about 60% below the SWS DCF model estimate of future cash flow value at $65.50, investors are seeing a split message between an earnings based multiple that is richer than peers and a cash flow based valuation that suggests a wide discount. That tension may reflect the market placing a premium on current high quality earnings and a strong 23.2% return on equity, while still pricing in uncertainty around how consistent those cash flows will be.
Compared with the US Oil and Gas industry average P/E of 13.9x, DMLP's 18.9x multiple stands out as meaningfully higher. This implies the market currently assigns it a richer earnings tag than the sector overall.
Result: Price-to-earnings of 18.9x (OVERVALUED).
However, you also need to consider risks such as weaker commodity prices squeezing royalty income, as well as any reassessment of that 60% intrinsic discount estimate.
Another view: cash flow points the other way
While the P/E of 18.9x makes DMLP look expensive next to peers, the SWS DCF model presents a different perspective. With an estimated future cash flow value of $65.50 versus a $26.08 share price, the stock appears heavily undervalued on this second lens.
This creates a clear tension to weigh, with earnings suggesting a premium tag and cash flows suggesting a wide gap. Which signal matters more for your own approach: the headline multiple or the long term cash generation potential?
Simply Wall St performs a discounted cash flow (DCF) on every stock in the world every day (check out Dorchester Minerals for example). We show the entire calculation in full. You can track the result in your watchlist or portfolio and be alerted when this changes, or use our stock screener to discover 51 high quality undervalued stocks. If you save a screener we even alert you when new companies match - so you never miss a potential opportunity.
Next Steps
The split between rich P/E and discounted cash flow value makes sentiment around Dorchester Minerals mixed. It is worth checking the numbers for yourself while this setup is fresh and forming. To round out that view, take a moment to weigh the 1 key reward and 1 important warning sign.
Looking for more investment ideas?
If Dorchester Minerals has you thinking more seriously about where your capital works hardest, this is a great time to widen the net and compare options.
Use the Simply Wall St Screener to quickly stack other opportunities against what you have just seen here, so your next move is based on clear, side by side context.
- Target stronger long term value candidates by checking companies highlighted in the 51 high quality undervalued stocks and see how their pricing compares to your current watchlist.
- Strengthen the income side of your portfolio by reviewing the 12 dividend fortresses and spotting stocks that align with your yield expectations.
- Control downside risk more deliberately by scanning through the 72 resilient stocks with low risk scores and weighing them against higher volatility ideas you already hold.
This article by Simply Wall St is general in nature. We provide commentary based on historical data and analyst forecasts only using an unbiased methodology and our articles are not intended to be financial advice. It does not constitute a recommendation to buy or sell any stock, and does not take account of your objectives, or your financial situation. We aim to bring you long-term focused analysis driven by fundamental data. Note that our analysis may not factor in the latest price-sensitive company announcements or qualitative material. Simply Wall St has no position in any stocks mentioned.