A Look At Erie Indemnity (ERIE) Valuation After Recent Share Price Swings
Erie Indemnity Company Class A ERIE | 0.00 |
Erie Indemnity stock snapshot after recent share price moves
Erie Indemnity (ERIE) has caught investor attention after recent price swings, with the stock last closing at US$227.22 and showing mixed short term and longer term return patterns.
The recent 1 day share price return of 3.51% and 7 day return of 6.64% sit against a year to date share price decline of 18.21% and a 1 year total shareholder return decline of 37.68%. This suggests that recent momentum is tentative after a weaker period.
If you are weighing Erie Indemnity's swings against other opportunities in financials, it can help to broaden your watchlist with 21 top founder-led companies
With Erie Indemnity trading at US$227.22 and an estimated 14% intrinsic value gap, the key question is whether this reflects an undervalued stock or if the recent rebound means the market is already pricing in expectations for the company.
Price-to-Earnings of 20.8x: Is it justified?
On earnings, Erie Indemnity currently trades on a P/E of 20.8x, which sits against the last close of $227.22 and points to a richer valuation than many peers.
The P/E multiple compares the share price to earnings per share and is a common shorthand for how much investors are willing to pay for each dollar of profit. For an insurance services business like Erie Indemnity, this often reflects expectations around the stability of earnings, return on equity and the perceived quality of the underlying business model.
In Erie Indemnity's case, the stock is viewed as trading at 13.5% below an internal estimate of fair value based on the SWS DCF model. However, the P/E of 20.8x is higher than both the US Insurance industry average of 10.5x and a peer group average of 13x. That combination suggests the market is placing a premium on current profitability metrics such as a 24.3% return on equity and past 5 year earnings growth, even though earnings declined over the most recent year and recent share price performance has lagged both the broader US market and the US Insurance industry.
Compared with sector benchmarks, the contrast is clear. A 20.8x P/E is almost double the 10.5x industry average and also well ahead of the 13x peer average. This indicates that Erie Indemnity is priced at a meaningful premium to many US insurance stocks despite its weaker 1 year total return and more recent earnings softness.
Result: Price-to-Earnings of 20.8x (OVERVALUED)
However, the richer P/E and weaker 1 year total return leave the stock vulnerable if earnings soften further or if sentiment toward US insurance stocks cools.
Another view: DCF points in the opposite direction
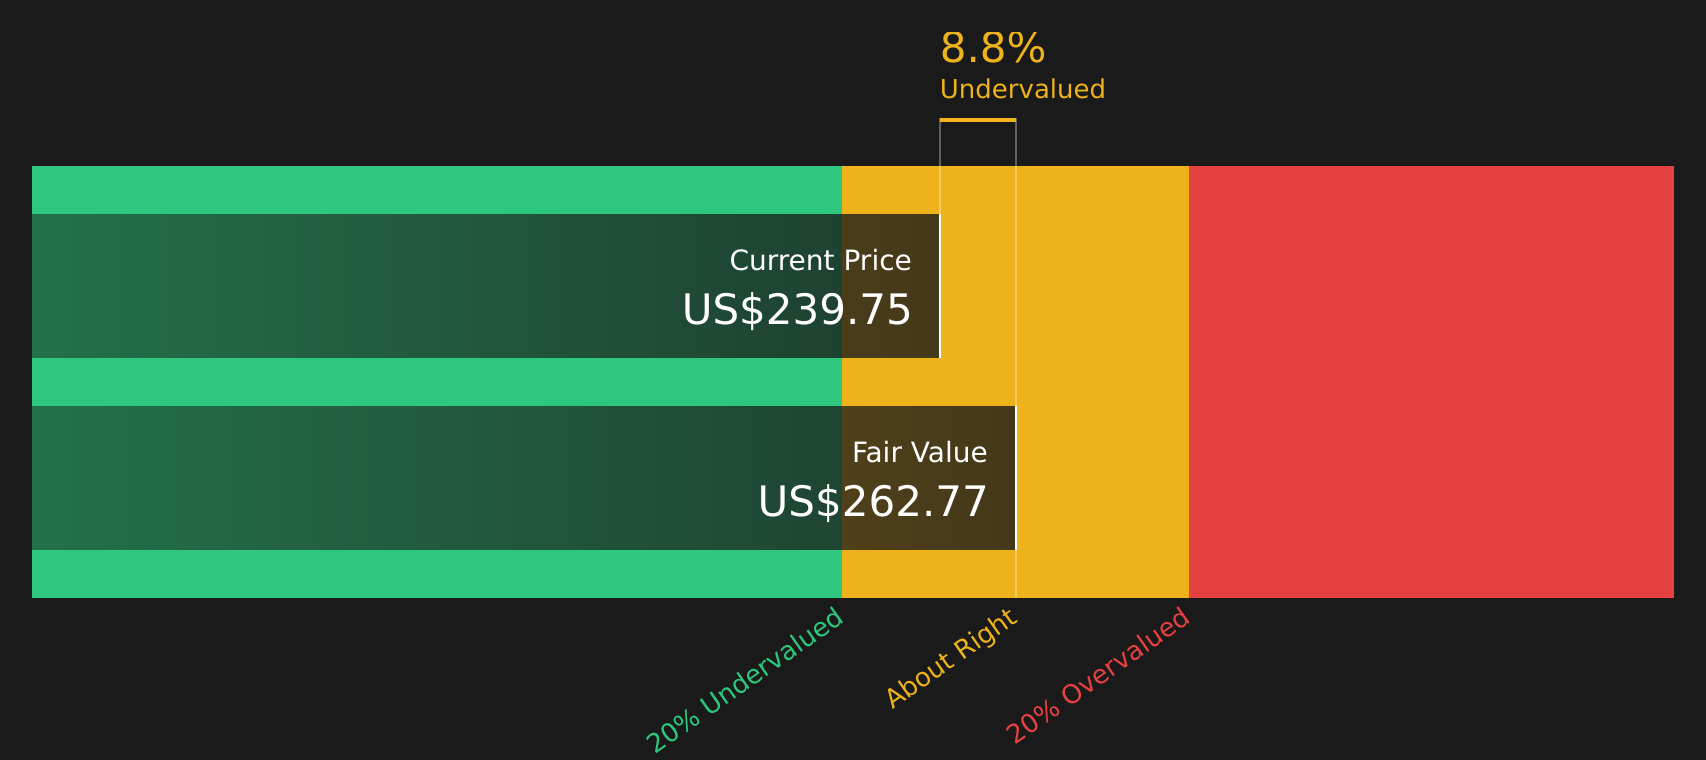
While the 20.8x P/E ratio suggests Erie Indemnity is expensive next to industry and peer averages, the SWS DCF model points the other way. With the stock at $227.22 and an estimated future cash flow value of $262.77, this approach frames ERIE as trading at a discount. Which signal matters more to you, the earnings multiple or the cash flow view?
Simply Wall St performs a discounted cash flow (DCF) on every stock in the world every day (check out Erie Indemnity for example). We show the entire calculation in full. You can track the result in your watchlist or portfolio and be alerted when this changes, or use our stock screener to discover 49 high quality undervalued stocks. If you save a screener we even alert you when new companies match - so you never miss a potential opportunity.
Next Steps
The combination of premium pricing and DCF signals sends a mixed message, so it makes sense to look under the hood yourself and move quickly while sentiment is still forming. To see what is driving optimism around the stock, review the 2 key rewards
Looking for more investment ideas?
If Erie Indemnity is on your radar, do not stop there. Broaden your opportunity set now so you are not relying on a single stock story.
- Spot potential mispricings early by reviewing 49 high quality undervalued stocks that combine quality fundamentals with attractive valuations.
- Strengthen your income stream by checking out 9 dividend fortresses built around robust yields and resilient payout histories.
- Reduce portfolio stress by focusing on 64 resilient stocks with low risk scores that screen well on financial stability and volatility measures.
This article by Simply Wall St is general in nature. We provide commentary based on historical data and analyst forecasts only using an unbiased methodology and our articles are not intended to be financial advice. It does not constitute a recommendation to buy or sell any stock, and does not take account of your objectives, or your financial situation. We aim to bring you long-term focused analysis driven by fundamental data. Note that our analysis may not factor in the latest price-sensitive company announcements or qualitative material. Simply Wall St has no position in any stocks mentioned.