A Look At First Busey (BUSE) Valuation After Zacks Rank Upgrade And Earnings Surprises
First Busey Corporation BUSE | 0.00 |
First Busey (BUSE) is back on investor radars after an upgrade to Zacks Rank #2 (Buy), along with two consecutive quarters of positive earnings surprises and increasingly optimistic analyst expectations.
The recent Zacks Rank upgrade and earnings beats come alongside firming share price momentum, with a 30 day share price return of 8.06%, a 90 day share price return of 11.78%, and a 1 year total shareholder return of 43.42%, all based on a latest share price of US$26.67.
If you are looking beyond regional banks for what is moving next, this could be a good moment to hunt for opportunities in 18 top founder-led companies
With earnings surprises, a Zacks Rank upgrade and an indicated intrinsic value suggesting roughly a 48% discount, is the recent share price strength simply catching up to fundamentals, or is the market already pricing in the next leg of growth?
Preferred P/E of 18.2x: Is It Justified?
On a simple P/E check, First Busey trades on 18.2x earnings, which looks expensive against peers despite the recent share price sitting at $26.67.
The P/E ratio compares what you pay per share to the company’s earnings per share, so a higher multiple usually means the market is placing a richer price on each dollar of profit. For a bank, that can reflect expectations around earnings growth, perceived balance sheet strength, or the reliability of dividend income.
Here, the picture is mixed. First Busey is flagged as trading at a premium to the US Banks industry average P/E of 11.9x and to the peer average of 11.6x. It also sits above an estimated fair P/E of 17.3x that our regression based fair ratio suggests the market could gravitate toward over time.
Result: Price-to-Earnings of 18.2x (OVERVALUED)
However, the story could wobble if regional banking sentiment turns cautious again or if earnings slip. This might challenge the current premium P/E and intrinsic value gap.
Another View: Cash Flows Point the Other Way
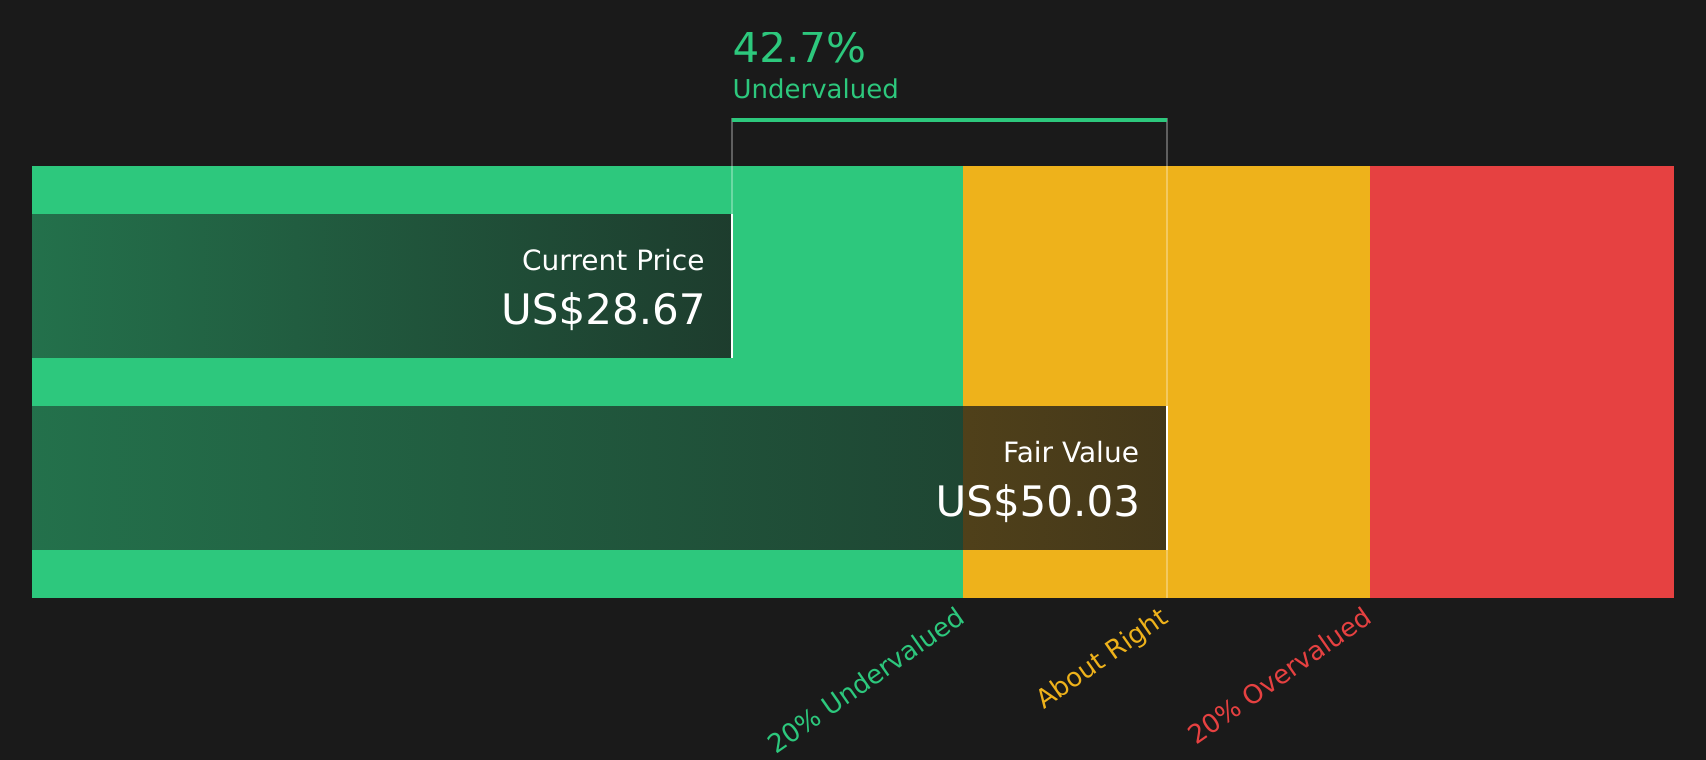
While the P/E of 18.2x suggests First Busey appears expensive compared with bank peers and a fair ratio, our DCF model presents a different perspective. In this view, the current $26.67 share price is roughly 48% below an estimated future cash flow value of $51.46, indicating a wide valuation gap.
This kind of disconnect between earnings-based pricing and cash-flow-based value can be interpreted in different ways, so the key question is which lens feels more reliable for a regional bank like this.
Simply Wall St performs a discounted cash flow (DCF) on every stock in the world every day (check out First Busey for example). We show the entire calculation in full. You can track the result in your watchlist or portfolio and be alerted when this changes, or use our stock screener to discover 58 high quality undervalued stocks. If you save a screener we even alert you when new companies match - so you never miss a potential opportunity.
Next Steps
Feeling torn between the risks and the potential rewards in this story? Act while the information is fresh and weigh both sides with the 3 key rewards and 1 important warning sign
Looking for more investment ideas?
If you are ready to widen your watchlist, use the Simply Wall St screener to quickly spot fresh ideas that fit your own style and risk comfort.
- Target resilient returns by focusing on companies in the 72 resilient stocks with low risk scores that may help steady your portfolio when single names feel uncertain.
- Hunt for potential mispricing with the 58 high quality undervalued stocks and see which companies currently trade at what could be attractive valuations.
- Strengthen quality in your holdings by filtering for financially sound names through the solid balance sheet and fundamentals stocks screener (41 results).
This article by Simply Wall St is general in nature. We provide commentary based on historical data and analyst forecasts only using an unbiased methodology and our articles are not intended to be financial advice. It does not constitute a recommendation to buy or sell any stock, and does not take account of your objectives, or your financial situation. We aim to bring you long-term focused analysis driven by fundamental data. Note that our analysis may not factor in the latest price-sensitive company announcements or qualitative material. Simply Wall St has no position in any stocks mentioned.