A Look At Liberty Energy (LBRT) Valuation After Q1 Beat Strait Of Hormuz Disruption And Capital Raise
Liberty Energy, Inc. Class A LBRT | 0.00 |
The closure of the Strait of Hormuz has pushed Brent crude near $107, and Liberty Energy (LBRT) has jumped into focus after a strong Q1 earnings beat and a fresh zero coupon convertible notes issuance.
At a share price of $32.95, Liberty Energy has seen strong momentum build, with a 30 day share price return of 18.61% and a year to date share price return of 74.52%. The 1 year total shareholder return of 175.29% reflects how recent earnings surprises and higher oil prices have shifted investor expectations.
If you are looking beyond Liberty Energy for stocks tied to energy infrastructure and power demand, this could be a useful moment to scan 38 power grid technology and infrastructure stocks
With the stock now sitting just below its average analyst price target and trading at what some models flag as a large intrinsic discount, the key question is simple: is Liberty Energy mispriced, or is the market already baking in its next growth phase?
Most Popular Narrative: 1% Overvalued
Liberty Energy's most followed narrative pegs fair value at $32.77, almost identical to the last close at $32.95, which puts the spotlight on the assumptions behind that figure.
Liberty's leadership in next-generation technology, including its digiPrime/digiFleet natural gas-powered frac solutions and modular, low-emission power generation, is enabling market share gains, operational efficiencies, longer asset life, and stronger pricing with top-tier customers, supporting improved margins and higher free cash flow.
Want to see what kind of revenue build, margin profile and future earnings multiple are baked into that fair value estimate? The underlying narrative leans heavily on faster top line growth, thinner margins and a much richer future valuation to justify today’s pricing.
Result: Fair Value of $32.77 (OVERVALUED)
However, there are still clear pressure points, including the expected softening in completions activity and the heavy reliance on North American frac and sand demand.
Another View: Cash Flows Tell a Very Different Story
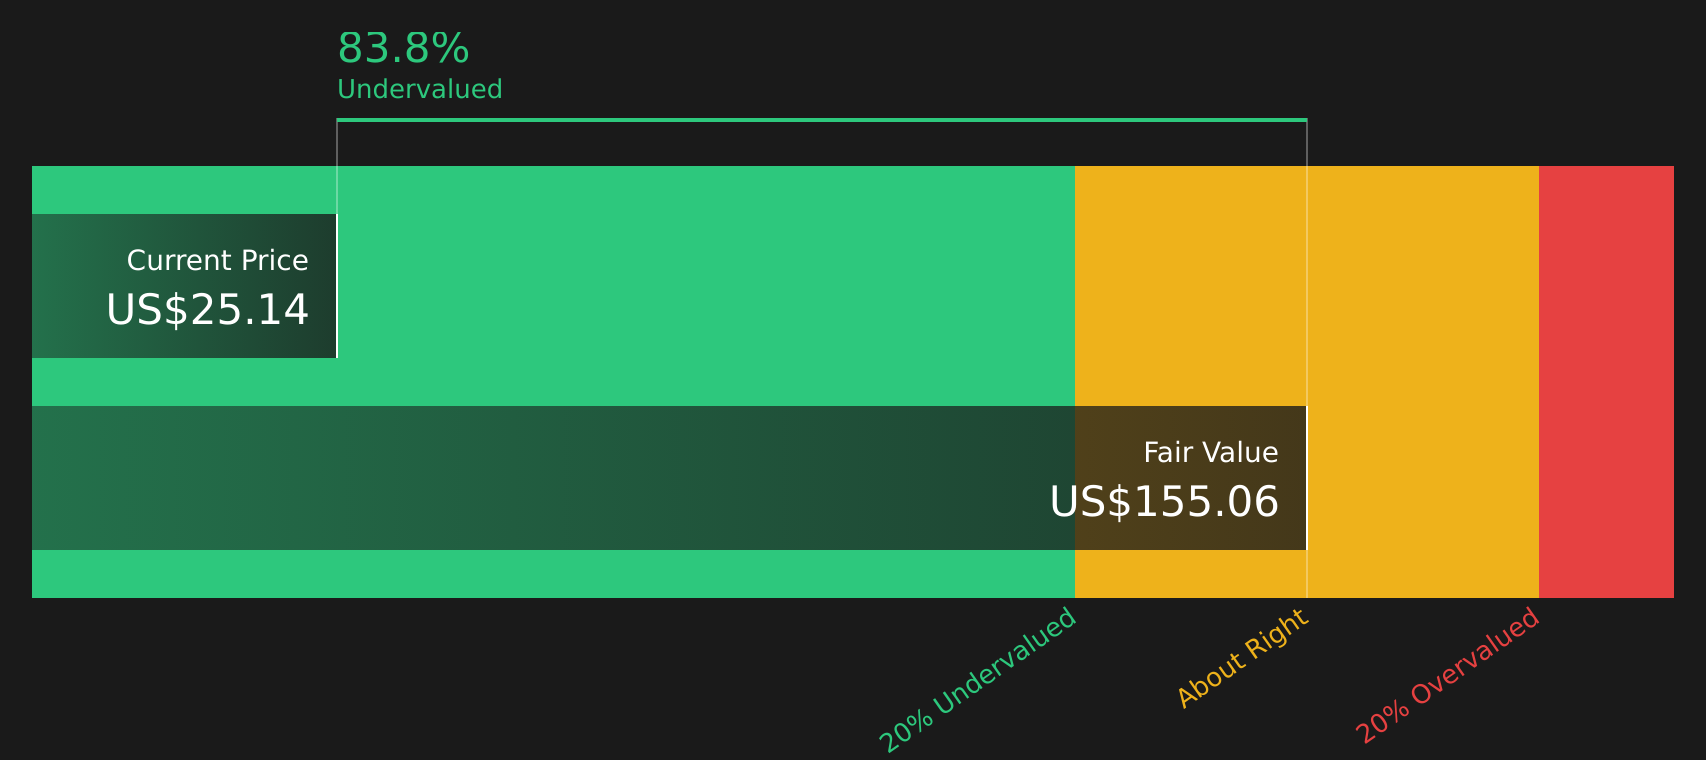
While the analyst narrative points to Liberty Energy trading roughly in line with a fair value of $32.77, our DCF model presents a contrasting perspective. On this approach, the stock at $32.95 appears significantly undervalued relative to an estimated future cash flow value of $133.78.
That kind of gap suggests either the DCF inputs are far too generous or the market is applying a substantial discount to the long term cash flow outlook. The key question for you is simple: which set of assumptions appears more realistic when you consider the actual risks and capital needs ahead?
Simply Wall St performs a discounted cash flow (DCF) on every stock in the world every day (check out Liberty Energy for example). We show the entire calculation in full. You can track the result in your watchlist or portfolio and be alerted when this changes, or use our stock screener to discover 50 high quality undervalued stocks. If you save a screener we even alert you when new companies match - so you never miss a potential opportunity.
Next Steps
With such a mixed picture of risks and rewards, do you want to rely on headlines or your own judgement? Take a closer look at the details and weigh both sides using our breakdown of 2 key rewards and 3 important warning signs
Looking for more investment ideas?
If you stop at Liberty Energy, you could miss other stocks that fit your goals. Put the Simply Wall Street Screener to work for you.
- Target reliable income by zeroing in on 12 dividend fortresses that aim to balance higher yields with resilience.
- Hunt for potential bargains using 50 high quality undervalued stocks that combine quality fundamentals with pricing that some investors may overlook.
- Prioritise capital protection first by filtering for 66 resilient stocks with low risk scores that focus on steadier profiles and fewer red flags.
This article by Simply Wall St is general in nature. We provide commentary based on historical data and analyst forecasts only using an unbiased methodology and our articles are not intended to be financial advice. It does not constitute a recommendation to buy or sell any stock, and does not take account of your objectives, or your financial situation. We aim to bring you long-term focused analysis driven by fundamental data. Note that our analysis may not factor in the latest price-sensitive company announcements or qualitative material. Simply Wall St has no position in any stocks mentioned.