A Look At St. Joe (JOE) Valuation After Recent Share Price Weakness
St. Joe Company JOE | 0.00 |
Recent performance context for St. Joe (JOE)
St. Joe (JOE) has seen its share price fall about 7% over the past month and around 11% over the past 3 months, setting a cautious backdrop for investors reviewing the stock.
Despite the recent pullback, St. Joe’s 1-year total shareholder return of 40.35% and 5-year total shareholder return of 46.63% point to a stronger long term outcome than its recent share price weakness suggests, with the current share price at $63.57.
If St. Joe’s recent moves have you reassessing your watchlist, it could be a good moment to widen your search and review 18 top founder-led companies
With St. Joe trading at $63.57 and an estimated intrinsic discount of 47.24%, the key question is whether this reflects an undervalued real estate developer or whether the market is already pricing in future growth.
Price-to-Earnings of 32.6x: Is it justified?
St. Joe trades on a P/E of 32.6x, which sits well above both its peer average of 16.1x and the broader US Real Estate industry average of 30.1x.
The P/E multiple compares the company’s share price to its earnings per share and is often used to gauge how much investors are willing to pay for each dollar of profit in real estate and other earnings generating businesses.
For St. Joe, a 32.6x P/E alongside 44.2% earnings growth over the past year and 9.8% yearly earnings growth over the past 5 years indicates that the market is attaching a premium to its profit profile and earnings quality.
Compared with a 16.1x peer average and a 30.1x sector average, St. Joe’s higher multiple shows that investors are paying a richer price than both close peers and the broader US Real Estate group.
Result: Price-to-Earnings of 32.6x (OVERVALUED)
However, if hospitality or residential demand softens, or if higher interest costs weigh on real estate activity, the current premium P/E could be hard to justify.
Another view: DCF points in the opposite direction
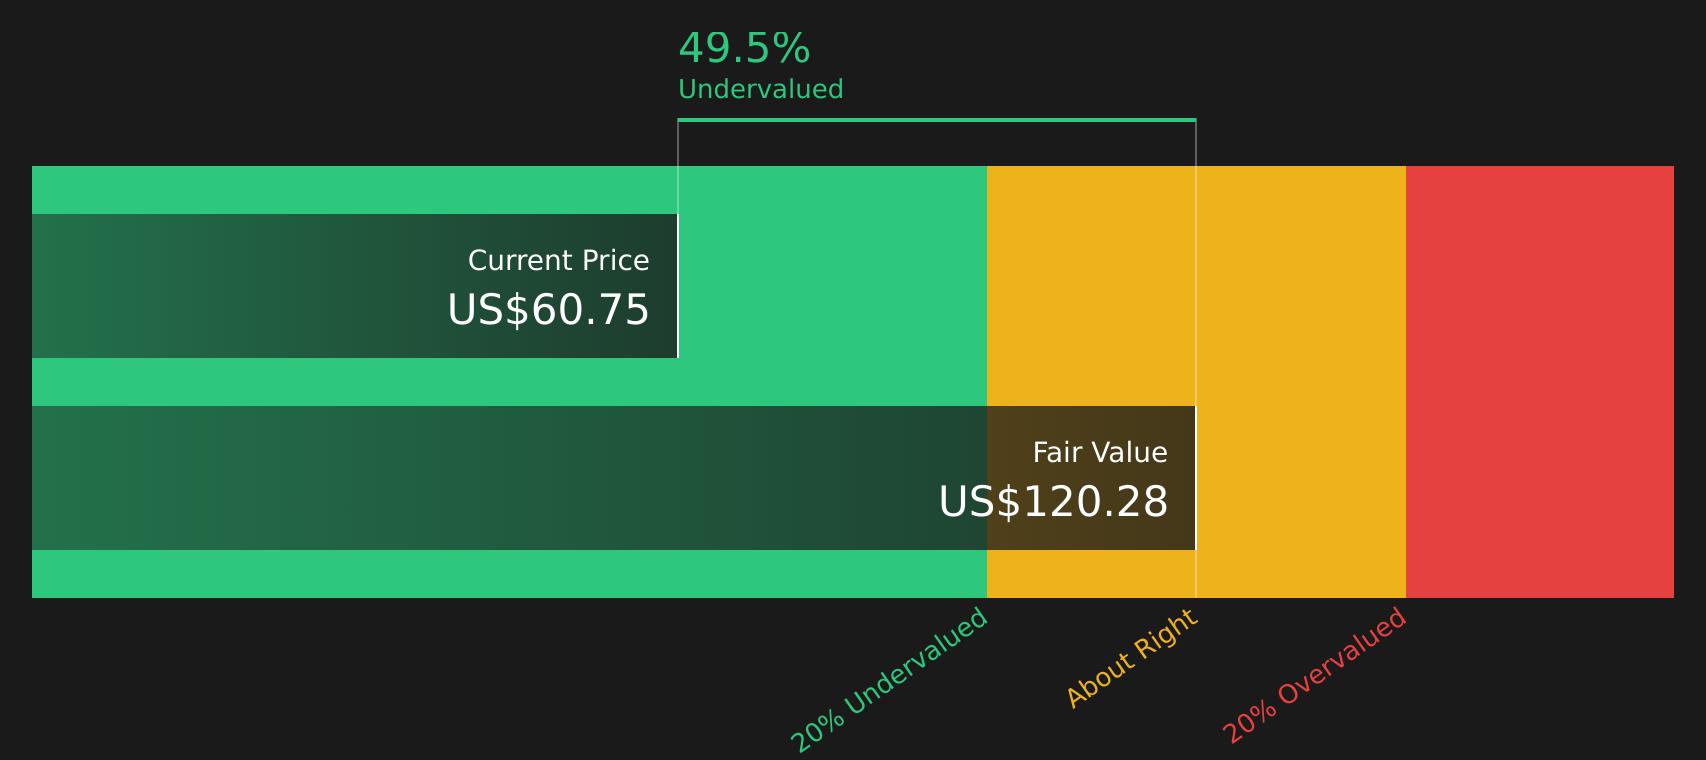
While the 32.6x P/E suggests St. Joe looks expensive against peers and the wider US Real Estate group, the SWS DCF model points the other way. With the stock at $63.57 versus an estimated future cash flow value of $120.50, it screens as undervalued by 47.2%.
This kind of gap between earnings based pricing and cash flow based value can signal either a cushion for long term investors or a sign that cash flow assumptions are too optimistic. Which side of that line do you think the stock sits on, and what would change your mind?
Simply Wall St performs a discounted cash flow (DCF) on every stock in the world every day (check out St. Joe for example). We show the entire calculation in full. You can track the result in your watchlist or portfolio and be alerted when this changes, or use our stock screener to discover 51 high quality undervalued stocks. If you save a screener we even alert you when new companies match - so you never miss a potential opportunity.
Next Steps
With such a mixed picture, the key question is how you interpret the balance of risks and rewards, so consider moving quickly, reviewing the numbers, and shaping your own stance by checking 2 key rewards and 1 important warning sign
Looking for more investment ideas?
If St. Joe has sharpened your thinking, do not stop there. Use the Simply Wall Street Screener to spot fresh ideas before they move away from you.
- Target reliable income by reviewing 14 dividend fortresses that combine higher yields with a focus on durability.
- Zero in on quality at a sensible price by checking 51 high quality undervalued stocks that pair solid fundamentals with appealing valuations.
- Stay one step ahead of the crowd by tracking a screener containing 21 high quality undiscovered gems before broader attention arrives.
This article by Simply Wall St is general in nature. We provide commentary based on historical data and analyst forecasts only using an unbiased methodology and our articles are not intended to be financial advice. It does not constitute a recommendation to buy or sell any stock, and does not take account of your objectives, or your financial situation. We aim to bring you long-term focused analysis driven by fundamental data. Note that our analysis may not factor in the latest price-sensitive company announcements or qualitative material. Simply Wall St has no position in any stocks mentioned.