A Look At Terex (TEX) Valuation As Recent Gains Meet Mixed Analyst Targets
Terex Corporation TEX | 63.26 | +0.14% |
Terex stock moves and recent performance snapshot
Terex (TEX) shares recently closed at $61.54 after a 1-day return of around a 2% decline, following a mixed stretch that includes a small gain over the past month and a stronger move in the past 3 months.
That 1-day share price decline sits against a firm upswing, with a 7-day share price return of 4.32%, a 90-day share price return of 37.67%, and a 1-year total shareholder return of 40.12%. Taken together, these figures point to momentum building rather than fading around Terex at the current US$61.54 level.
If Terex’s recent run has you thinking about where else capital equipment trends might show up, consider widening your search into 29 robotics and automation stocks as a way to spot other potential industrial candidates.
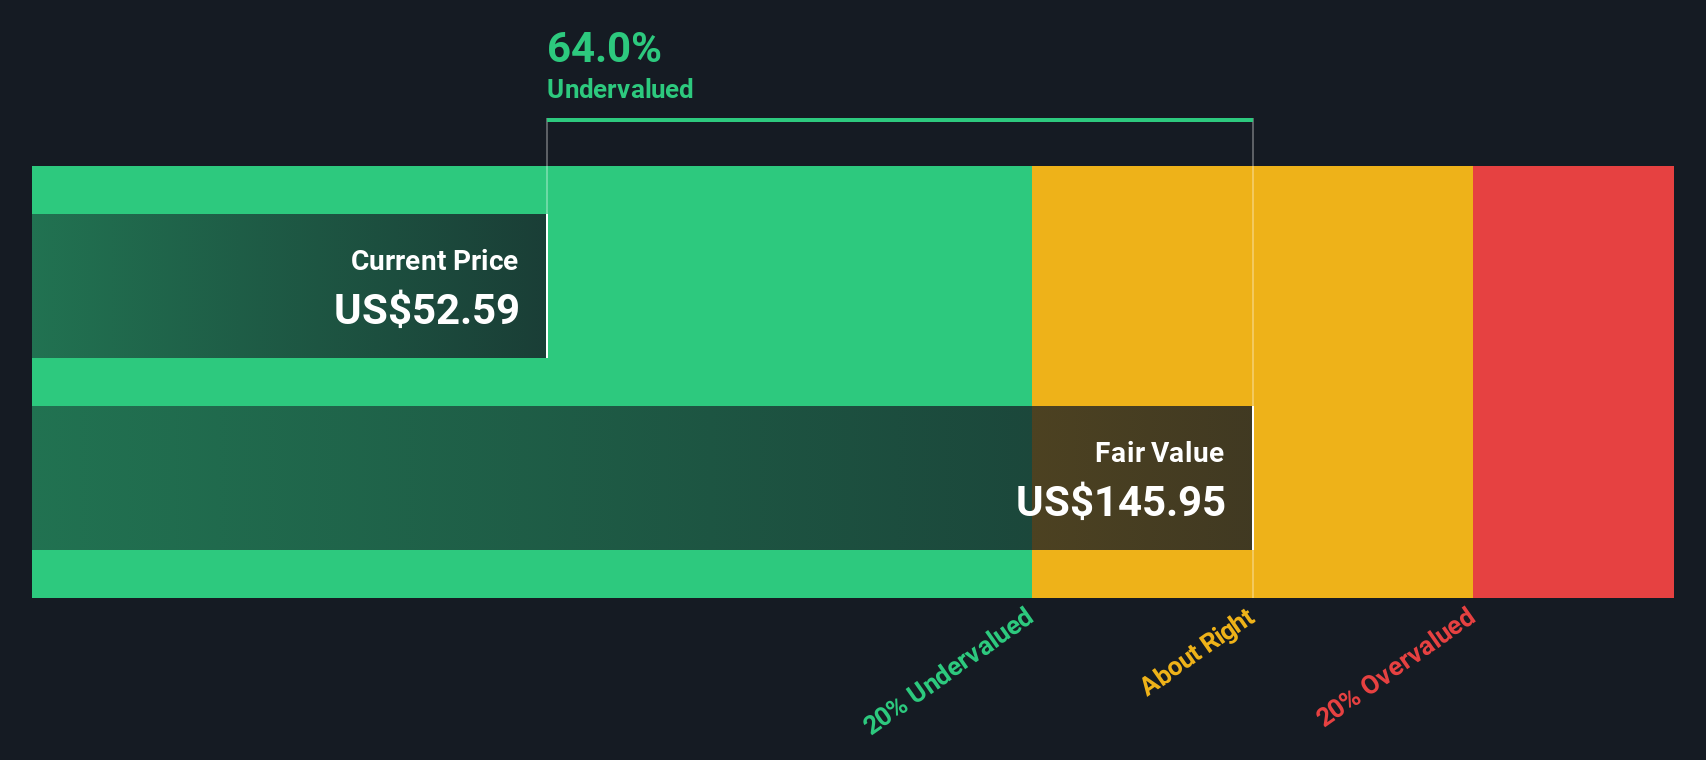
With Terex trading at US$61.54 and some measures suggesting a single digit discount to certain value estimates, the real question is whether this represents an undervalued industrial player or a stock that already reflects expectations of future growth in its price.
Most Popular Narrative: 5% Undervalued
With Terex last closing at $61.54 and the most followed narrative pointing to a fair value of about $64.75, the current setup hinges on how future earnings, margins, and cash flows evolve against that discounted cash flow view.
The analysts have a consensus price target of $55.2 for Terex based on their expectations of its future earnings growth, profit margins and other risk factors. However, there is a degree of disagreement amongst analysts, with the most bullish reporting a price target of $73.0 and the most bearish reporting a price target of just $38.0.
Want to see what is really sitting behind that fair value? Revenue expansion, margin rebuild, and a lower future earnings multiple all have to work together. The exact mix of those moving parts is where the narrative gets interesting.
Result: Fair Value of $64.75 (UNDERVALUED)
However, weaker construction demand or extended caution from rental customers could still pressure orders and margins, putting that 5% undervalued narrative to the test.
Another view: rich P/E tempers that DCF upside
Our DCF model points to Terex being undervalued, with the shares at $61.54 compared with an estimated future cash flow value of $66.68. However, the current 44.8x P/E is higher than the US Machinery industry at 29.2x, the peer average at 28x, and even its own 37.9x fair ratio. This raises the question of how much good news is already in the price.
Build Your Own Terex Narrative
If you look at these numbers and come to a different conclusion, or simply want to test your own assumptions, you can build a custom view in just a few minutes by starting with Do it your way.
A great starting point for your Terex research is our analysis highlighting 2 key rewards and 4 important warning signs that could impact your investment decision.
Ready for more investment ideas beyond Terex?
If you stop your research with one stock, you will miss other angles the market is offering right now, so give yourself options with a broader search.
- Start building a watchlist of quality names by scanning our 52 high quality undervalued stocks that pair strong fundamentals with prices that appear below their estimated worth.
- Lock in potential income streams by checking out 14 dividend fortresses, focused on companies offering 5%+ yields with an emphasis on durability.
- Sleep a little easier by reviewing 83 resilient stocks with low risk scores, spotlighting businesses screened for more resilient balance sheets and lower overall risk scores.
This article by Simply Wall St is general in nature. We provide commentary based on historical data and analyst forecasts only using an unbiased methodology and our articles are not intended to be financial advice. It does not constitute a recommendation to buy or sell any stock, and does not take account of your objectives, or your financial situation. We aim to bring you long-term focused analysis driven by fundamental data. Note that our analysis may not factor in the latest price-sensitive company announcements or qualitative material. Simply Wall St has no position in any stocks mentioned.