A Look At Trinity Capital (TRIN) Valuation After New Torus Equipment Financing Commitment
Trinity Capital, Inc. TRIN | 0.00 |
Trinity Capital (TRIN) recently committed up to $35 million in equipment financing to Torus, supporting the expansion of its GigaOne manufacturing facility and adding another energy technology exposure to Trinity’s equipment finance portfolio.
The recent Torus financing sits alongside firm share price momentum, with a 30 day share price return of 13.28% and a year to date share price return of 12.76%. The 1 year total shareholder return of 39.49% and 5 year total shareholder return of 132.90% indicate investors have been rewarded over time.
If this kind of targeted equipment financing interests you, it can be worth widening the lens to other energy and infrastructure related plays using our 35 power grid technology and infrastructure stocks
With TRIN trading around US$16.97, close to its analyst price target yet screened as having roughly a 10% intrinsic discount, you have to ask: is there still value on the table, or is the market already pricing in expected performance?
Most Popular Narrative: 1% Overvalued
The most followed narrative currently places Trinity Capital's fair value at $16.83, slightly below the last close of $16.97, framing a tightly balanced setup.
The analysts have a consensus price target of $16.83 for Trinity Capital based on their expectations of its future earnings growth, profit margins and other risk factors. However, there is a degree of disagreement amongst analysts, with the most bullish reporting a price target of $19.0, and the most bearish reporting a price target of just $13.5.
Want to see what is sitting underneath that narrow valuation gap? The narrative focuses on steady revenue build, firm margins and a richer earnings multiple. The exact mix of growth, profitability and discount rate assumptions may surprise you.
Result: Fair Value of $16.83 (OVERVALUED)
However, that narrow valuation gap can quickly shift if venture debt demand softens or credit quality weakens, especially when higher P/E assumptions are already built into the story.
Another View: Cash Flows Point to Undervaluation
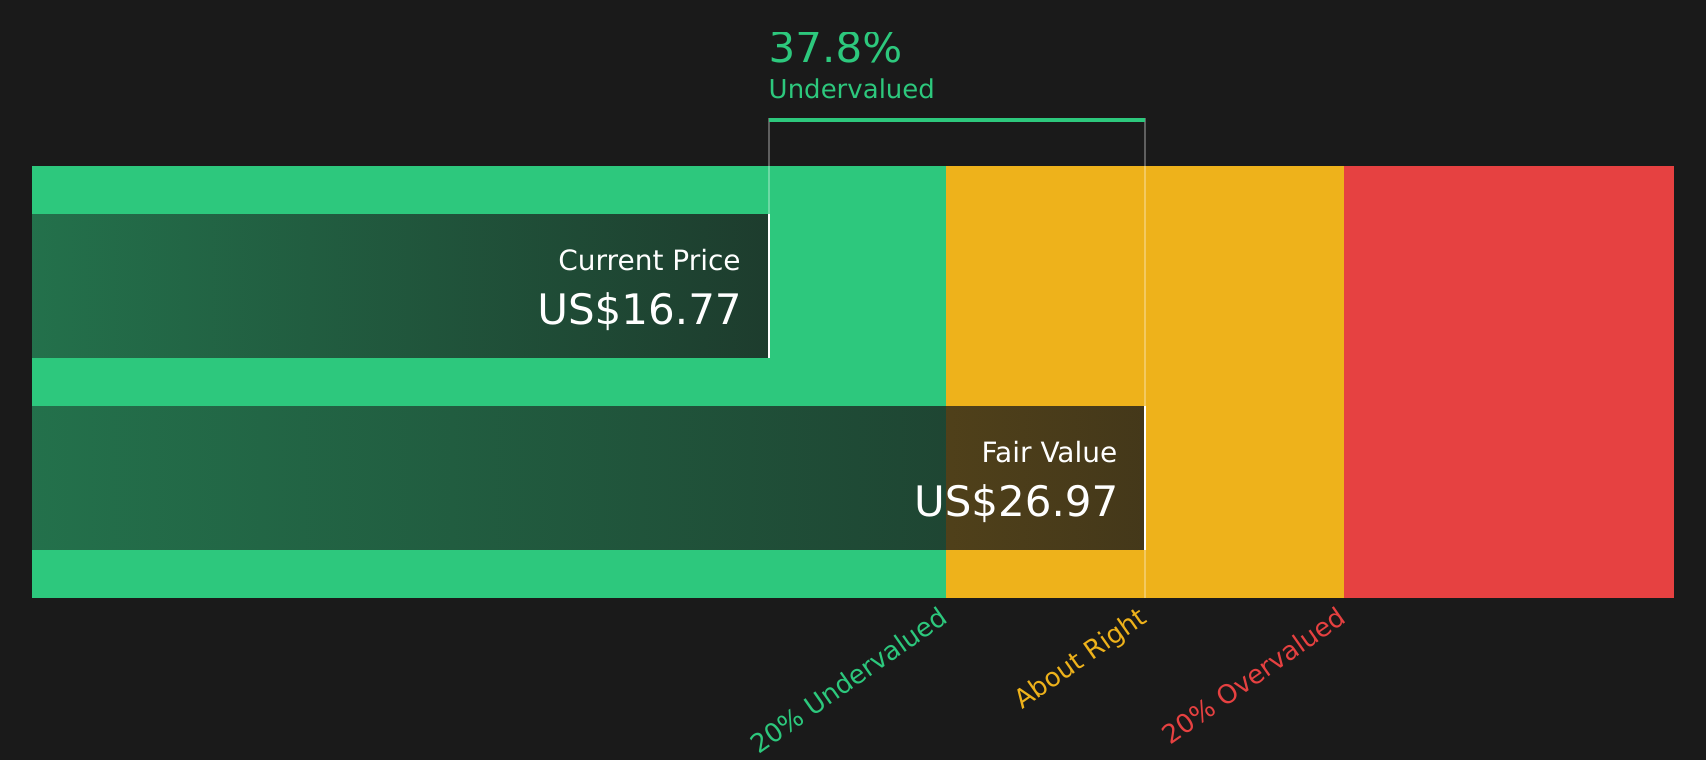
While the analyst target suggests Trinity Capital is roughly 1% overvalued at $16.97 versus a $16.83 fair value, the SWS DCF model points in the opposite direction, with fair value at $18.68 and the stock around 10% below that mark. So which signal do you trust more: the market or the cash flows?
Simply Wall St performs a discounted cash flow (DCF) on every stock in the world every day (check out Trinity Capital for example). We show the entire calculation in full. You can track the result in your watchlist or portfolio and be alerted when this changes, or use our stock screener to discover 48 high quality undervalued stocks. If you save a screener we even alert you when new companies match - so you never miss a potential opportunity.
Next Steps
Seeing mixed signals on TRIN and wondering what really matters most for you right now? Take a closer look at both sides of the story, weigh the trade off between potential upside and the issues investors are watching, and decide where you stand with 3 key rewards and 4 important warning signs
Looking for more investment ideas?
If TRIN has caught your attention, do not stop here; broaden your watchlist with other focused ideas that could fit different roles in your portfolio.
- Target higher yield potential by exploring dependable income candidates in the 12 dividend fortresses.
- Start hunting for value by reviewing companies that screen well in the 48 high quality undervalued stocks.
- Prioritize staying power by checking stocks that pass the tests in the 70 resilient stocks with low risk scores.
This article by Simply Wall St is general in nature. We provide commentary based on historical data and analyst forecasts only using an unbiased methodology and our articles are not intended to be financial advice. It does not constitute a recommendation to buy or sell any stock, and does not take account of your objectives, or your financial situation. We aim to bring you long-term focused analysis driven by fundamental data. Note that our analysis may not factor in the latest price-sensitive company announcements or qualitative material. Simply Wall St has no position in any stocks mentioned.