A Look At W. R. Berkley (WRB) Valuation After Recent Share Price Pullback And Modest Undervaluation Estimate
W. R. Berkley Corporation WRB | 0.00 |
How W. R. Berkley’s recent performance looks in context
W. R. Berkley (WRB) stock has delivered mixed returns recently, with a gain over the past week but declines over the past month and past 3 months, leaving the year to date performance in negative territory.
Over a longer horizon, the stock shows a very different picture, with multi year total returns over the past 3 and 5 years that are well ahead of the recent shorter term pullback. This contrast may catch your eye if you track performance across cycles.
The recent 1-day share price return of 1.56% and 7-day gain of 3.13% at a latest share price of US$66.31 suggest short term momentum is picking up, even as the year to date share price return is still down 4.4% and the 1-year total shareholder return is down 7.84%, compared with 3-year and 5-year total shareholder returns of 86.54% and 123.01% respectively.
If you are comparing W. R. Berkley with other opportunities in financials, it can help to broaden your search and scan 21 top founder-led companies
With WRB trading close to analyst targets and carrying a value score of 2 despite a recent pullback, is the stock still offering a margin of safety or has the market already priced in future growth potential?
Most Popular Narrative: 3% Undervalued
Against the last close of $66.31, the most followed narrative points to a fair value of about $68.33, suggesting a modest valuation gap based on detailed long term assumptions.
The analysts have a consensus price target of $72.733 for W. R. Berkley based on their expectations of its future earnings growth, profit margins and other risk factors. However, there is a degree of disagreement amongst analysts, with the most bullish reporting a price target of $86.0, and the most bearish reporting a price target of just $56.0.
Read the complete narrative. Read the complete narrative.
Want to see what is sitting behind that fair value band and tight discount rate work? The narrative leans heavily on earnings resilience, margin tweaks and only modest shifts in long term revenue expectations. Curious how those ingredients are combined to arrive at a fair value just above today’s price? The full breakdown joins the dots between projected profits, valuation multiples and that $68 handle.
Result: Fair Value of $68.33 (UNDERVALUED)
However, this depends on pricing and loss trends not worsening. Softening commercial and reinsurance markets or higher claim costs could quickly challenge that fair value story.
Wall Street's queuing for one rocket. While SpaceX counts down to its IPO, other companies tied to the new space race are already in orbit. → 20 Compelling Space Companies watchlist · Global Space Race Investing Ideas screener · Scan the sector by valuation on Rocket Lab's valuation page.
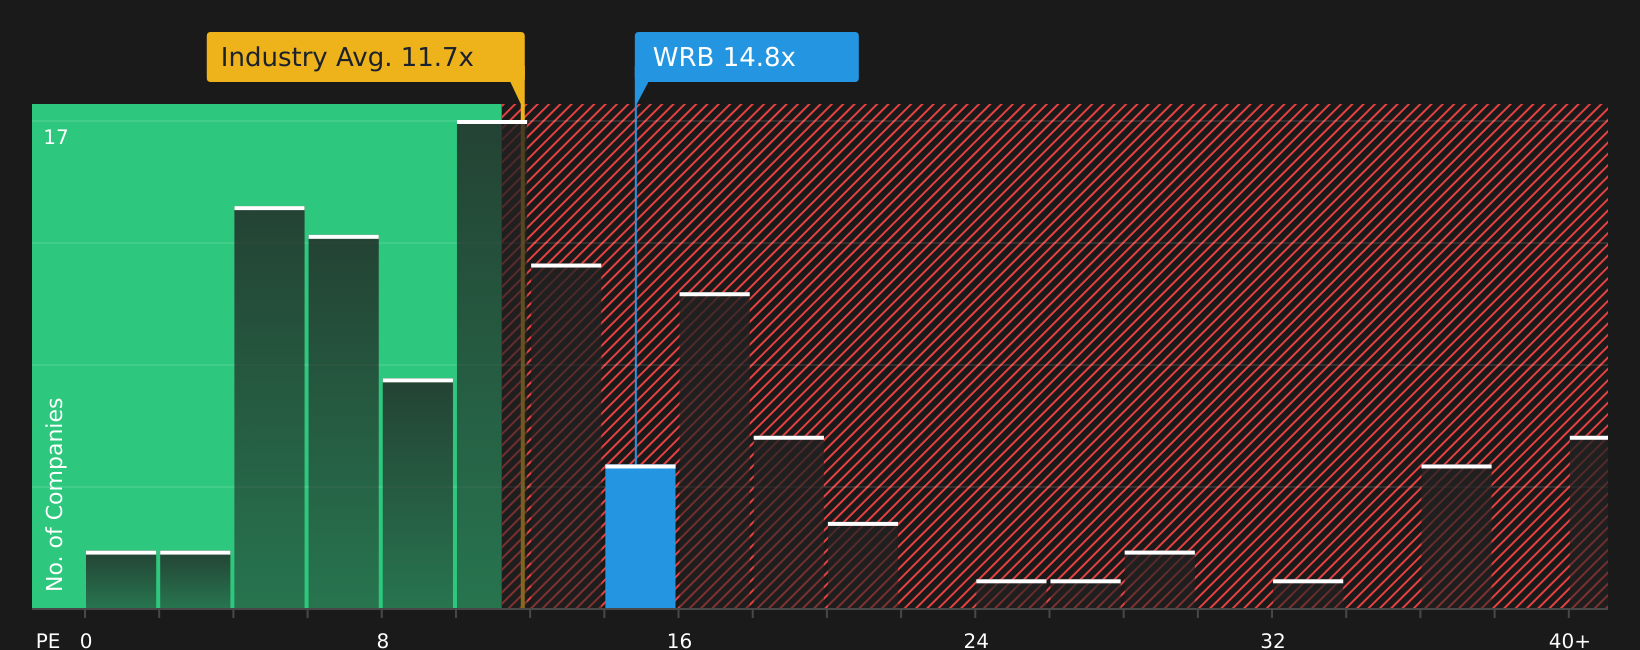
Another View: What P/E Says About WRB
The fair value work at $68.33 paints WRB as slightly undervalued, but the P/E picture is tougher. At 13.8x earnings, the stock trades above both peers at 10.9x and the US insurance sector at 10.3x, compared with a fair ratio of 10.5x that the market could move toward. Is that premium a comfort or a concern for you?
To stress test this view against the earnings multiple, check the fuller valuation breakdown and see how much room there really is if sentiment cools: See what the numbers say about this price — find out in our valuation breakdown.
Next Steps
Mixed signals on recent performance and valuation can feel uncomfortable, so it helps to move fast, review the underlying data, and decide where you stand using the 2 key rewards and 1 important warning sign
Looking for more investment ideas?
If WRB has your attention, do not stop here; widening your search now could help you spot opportunities that others overlook while they stay focused on a single stock.
- Target potential mispricings by scanning companies that combine quality and attractive valuations using the 47 high quality undervalued stocks.
- Prioritize stability by reviewing companies with resilient metrics through the 64 resilient stocks with low risk scores.
- Hunt for lesser known opportunities with strong fundamentals via the screener containing 22 high quality undiscovered gems.
This article by Simply Wall St is general in nature. We provide commentary based on historical data and analyst forecasts only using an unbiased methodology and our articles are not intended to be financial advice. It does not constitute a recommendation to buy or sell any stock, and does not take account of your objectives, or your financial situation. We aim to bring you long-term focused analysis driven by fundamental data. Note that our analysis may not factor in the latest price-sensitive company announcements or qualitative material. Simply Wall St has no position in any stocks mentioned.