AI-Driven Margin Gains Could Be A Game Changer For XPO (XPO)
XPO, Inc. XPO | 0.00 |
- XPO, Inc. recently reported first-quarter 2026 results, with revenue rising to US$2,096 million and net income reaching US$101 million, both ahead of analyst expectations.
- The company’s North American less-than-truckload operations posted a 200-basis-point improvement in adjusted operating ratio, underpinned by AI-driven efficiency gains and better pricing.
- We’ll now examine how this AI-enabled margin improvement shapes XPO’s existing investment narrative and the risk–reward trade-off analysts see.
Rare earth metals are the new gold rush. Find out which 31 stocks are leading the charge.
XPO Investment Narrative Recap
To own XPO today, you need to believe that its North American LTL network and proprietary AI tools can keep translating into better margins, even in a choppy freight market. The latest quarter’s 200-basis-point improvement in adjusted operating ratio supports that thesis and reinforces the near term catalyst around further AI-driven efficiency gains. The biggest risk remains XPO’s heavy exposure to cyclical freight demand in a single core segment, which this report does not fundamentally change.
Among recent developments, XPO’s ongoing share repurchase activity stands out alongside Q1 2026 results. The company bought back about US$65 million of stock in Q4 2025, following nearly US$1.0 billion of repurchases under earlier programs. For investors focused on the risk reward around an expensive valuation and concentrated LTL exposure, this capital return policy sits directly against the backdrop of AI-enabled margin progress and cyclically exposed earnings.
Yet behind the margin gains, investors should also be aware of how XPO’s high leverage could interact with a prolonged freight downturn and...
XPO's narrative projects $9.9 billion revenue and $791.1 million earnings by 2029.
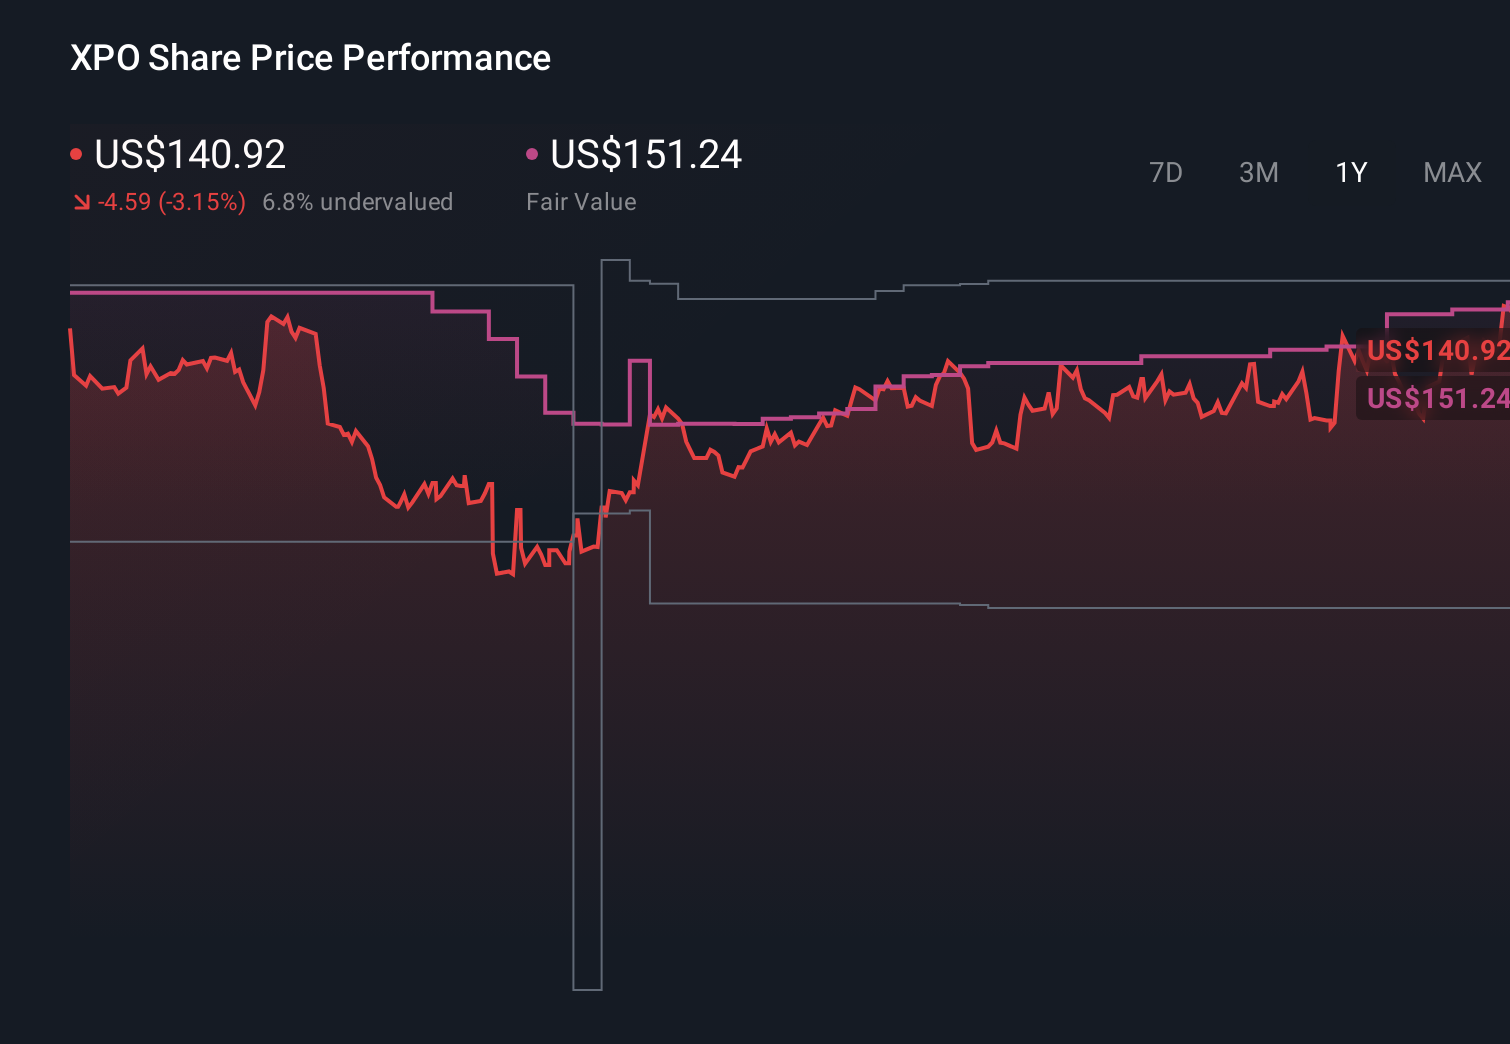
Uncover how XPO's forecasts yield a $219.61 fair value, in line with its current price.
Exploring Other Perspectives
Some of the most optimistic analysts were already penciling in about US$9.4 billion of revenue and US$752.3 million of earnings by 2028, so this upside surprise in Q1 2026 may either reinforce their case for faster margin expansion or prompt a rethink of how much risk elevated debt and heavy LTL exposure still represent to you.
Explore 3 other fair value estimates on XPO - why the stock might be worth 44% less than the current price!
Decide For Yourself
Don't just follow the ticker - dig into the data and build a conviction that's truly your own.
- A great starting point for your XPO research is our analysis highlighting 1 key reward and 1 important warning sign that could impact your investment decision.
- Our free XPO research report provides a comprehensive fundamental analysis summarized in a single visual - the Snowflake - making it easy to evaluate XPO's overall financial health at a glance.
Curious About Other Options?
Don't miss your shot at the next 10-bagger. Our latest stock picks just dropped:
- Invest in the nuclear renaissance through our list of 91 elite nuclear energy infrastructure plays powering the global AI revolution.
- Find 50 companies with promising cash flow potential yet trading below their fair value.
- We've uncovered the 13 dividend fortresses yielding 5%+ that don't just survive market storms, but thrive in them.
This article by Simply Wall St is general in nature. We provide commentary based on historical data and analyst forecasts only using an unbiased methodology and our articles are not intended to be financial advice. It does not constitute a recommendation to buy or sell any stock, and does not take account of your objectives, or your financial situation. We aim to bring you long-term focused analysis driven by fundamental data. Note that our analysis may not factor in the latest price-sensitive company announcements or qualitative material. Simply Wall St has no position in any stocks mentioned.