Alliant Energy (LNT) Valuation Check After Recent Share Price Strength And Mixed Fair Value Signals
Alliant Energy Corporation LNT | 0.00 |
Short term and recent performance snapshot
Alliant Energy (LNT) has drawn attention after a recent positive day, with the stock closing at $72.37, up about 0.9% over the past day and almost 2% over the past week.
Over the past month the stock shows a gain of about 0.9%, and over the past 3 months it is up roughly 2.2%. Year to date, the total return figure provided is 10.3%, with a 1 year total return of 22.6%.
The recent 1 day share price return of 0.92% adds to a year to date share price return of 10.34%. The 1 year total shareholder return of 22.64% and 5 year total shareholder return of 44.89% point to steady compounding over time.
If you are comparing Alliant Energy with other power and grid focused utilities, it can be helpful to scan the wider opportunity set using a focused screener such as 34 power grid technology and infrastructure stocks
With Alliant Energy showing double digit returns over 1 and 3 years and trading below the average analyst price target but above one intrinsic value estimate, is there still a buying opportunity here, or is future growth already priced in?
Most Popular Narrative: 8.5% Undervalued
Alliant Energy's most followed narrative pegs fair value at about $79.13, compared with the recent close at $72.37, framing the stock as modestly undervalued on that view.
The accelerating construction and onboarding of large-scale data centers in Alliant's Midwest service areas highlight a strong, sustained uptick in electricity demand, directly linked to population and economic growth in the region, which is expected to drive significant increases in revenue and top-line growth over the next several years.
The company's adaptive resource planning and regulatory flexibility in Iowa and Wisconsin allows rapid deployment of new generation capacity, positioning Alliant to capture higher allowed returns and efficiently expand its regulated asset base, supporting long-term earnings growth and margin expansion.
Curious what sits behind that fair value gap? The narrative leans heavily on projected revenue expansion, rising margins and a future earnings profile that assumes a premium P/E multiple persists.
Result: Fair Value of $79.13 (UNDERVALUED)
However, that story can change quickly if large data center projects are delayed, or if regulators in Iowa and Wisconsin take a tougher stance on future filings.
Wall Street's queuing for one rocket. While SpaceX counts down to its IPO, other companies tied to the new space race are already in orbit. → 20 Compelling Space Companies watchlist · Global Space Race Investing Ideas screener · Scan the sector by valuation on Rocket Lab's valuation page.
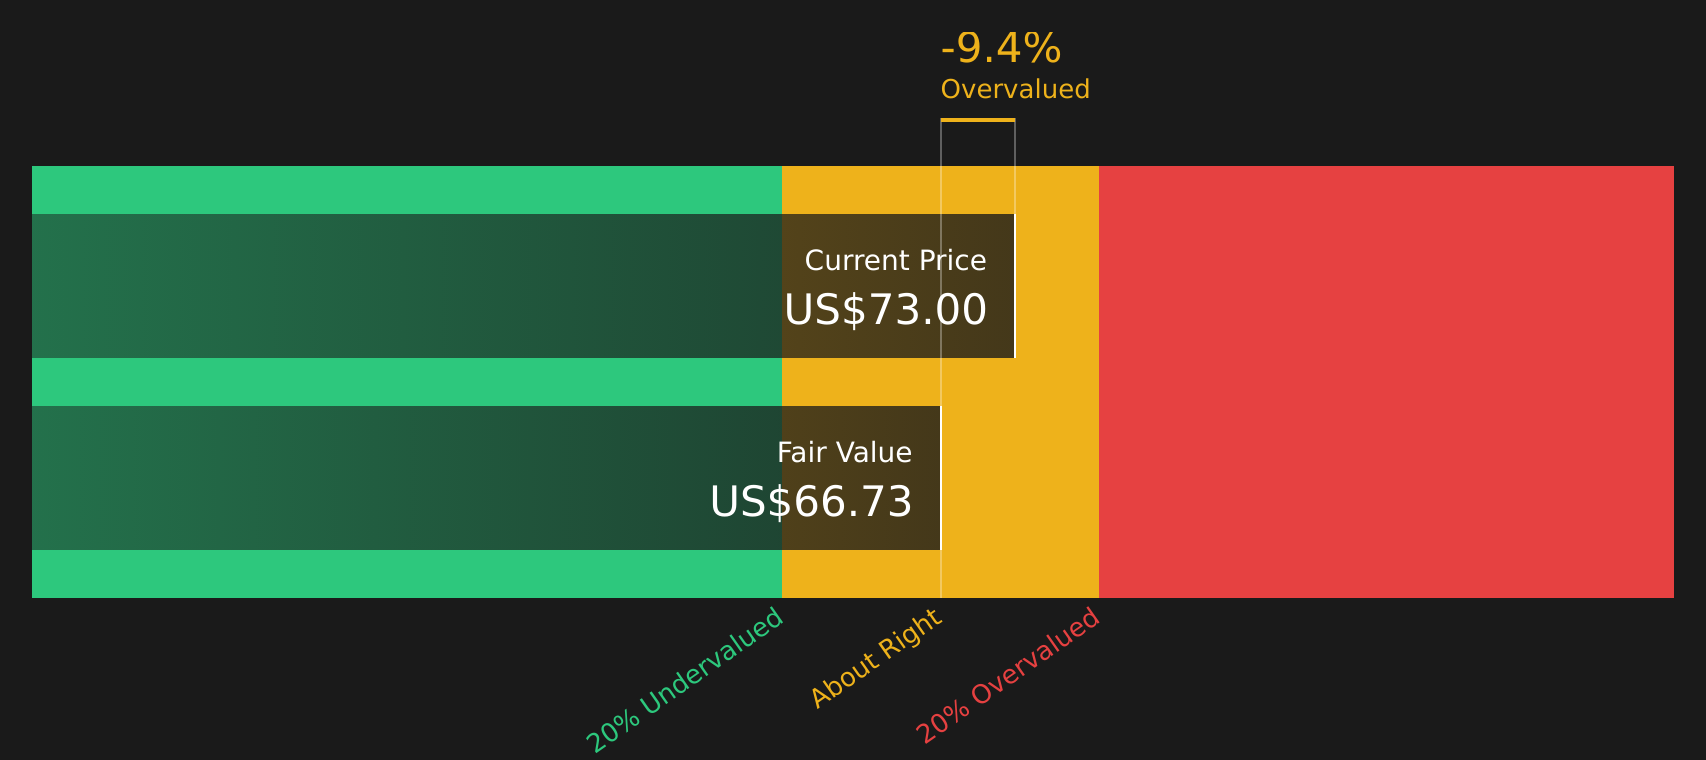
Another View: Cash Flows Point To A Tighter Margin Of Safety
While the popular narrative sees Alliant Energy as about 8.5% undervalued versus fair value of $79.13, the Simply Wall St DCF model tells a more cautious story. On that cash flow view, the stock at $72.37 sits above an intrinsic value estimate of $66.73, implying it screens as overvalued instead.
In plain terms, one approach leans on earnings and multiples to argue there is room to run, while the cash flow model suggests a thinner cushion and more valuation risk if growth or margins do not land as expected. Which lens do you trust more when the gap between them is this small?
Simply Wall St performs a discounted cash flow (DCF) on every stock in the world every day (check out Alliant Energy for example). We show the entire calculation in full. You can track the result in your watchlist or portfolio and be alerted when this changes, or use our stock screener to discover 46 high quality undervalued stocks. If you save a screener we even alert you when new companies match - so you never miss a potential opportunity.
Next Steps
If this mix of optimism and caution leaves you on the fence, take a moment now to review the key data points and stress test your own assumptions. Then, to round out your view, check the 2 key rewards and 2 important warning signs
Looking for more investment ideas?
If you stop here, you risk missing companies that might fit your style even better, so keep widening your lens before making any portfolio calls.
- Target reliable cash flows by scanning companies that consistently return capital through 9 dividend fortresses.
- Hunt for potential value opportunities by filtering for stocks that rank well on 46 high quality undervalued stocks.
- Prioritise resilience by focusing on companies that stand out in the 63 resilient stocks with low risk scores.
This article by Simply Wall St is general in nature. We provide commentary based on historical data and analyst forecasts only using an unbiased methodology and our articles are not intended to be financial advice. It does not constitute a recommendation to buy or sell any stock, and does not take account of your objectives, or your financial situation. We aim to bring you long-term focused analysis driven by fundamental data. Note that our analysis may not factor in the latest price-sensitive company announcements or qualitative material. Simply Wall St has no position in any stocks mentioned.