Apollo Global Management (APO) Stock Looks Rich After Austin Headquarters Move
Apollo Global Management Inc APO | 0.00 |
Apollo Global Management (APO) recently selected Austin, Texas as its second headquarters, highlighting a push toward deeper talent pools, tax efficiencies, and lower operating costs that could influence how investors evaluate the stock.
Recent moves like appointing senior leaders in London and selecting Austin for a second headquarters come as Apollo Global Management’s 90-day share price return of 24.53% contrasts with a year to date share price decline of 5.55%, while its 5-year total shareholder return of 163.05% points to meaningful long term value creation.
If this kind of repositioning has you thinking more broadly about where capital could flow next, it may be worth scanning other opportunities through the 20 top founder-led companies
So with Apollo Global Management shares up 24.53% over 90 days but still down 5.55% year to date, is the recent repositioning opening a window for investors, or is the market already pricing in the next phase of growth?
Preferred P/E of 69.1x: Is it justified?
Apollo Global Management shares last closed at $138.48, and on a P/E of 69.1x the market is paying a high price for each dollar of current earnings compared both to peers and the broader diversified financial sector.
The P/E ratio compares a company’s share price with its earnings per share, so a higher P/E often means investors are willing to pay more today for expected profit in the future. For a firm like Apollo Global Management, which operates across private equity, credit, and retirement services, that kind of premium usually reflects expectations for meaningful earnings improvement or a resilient profit profile rather than current profit margins alone.
Right now, that premium looks steep. Apollo Global Management is described as expensive versus the US Diversified Financial industry average P/E of 14.7x and also relative to a peer average P/E of 32.6x. This means the stock trades at more than double what similar companies command. It is also above an estimated fair P/E of 24.8x, a level the market could theoretically move toward if sentiment or expectations cool and valuation attention shifts back to earnings quality and return on equity.
Result: Price-to-Earnings of 69.1x (OVERVALUED)
However, investors in Apollo Global Management also need to weigh risks such as the recent 94.5% decline in revenue and the stock trading below an estimated intrinsic value.
Another View: What Does The DCF Say About Apollo Global Management?
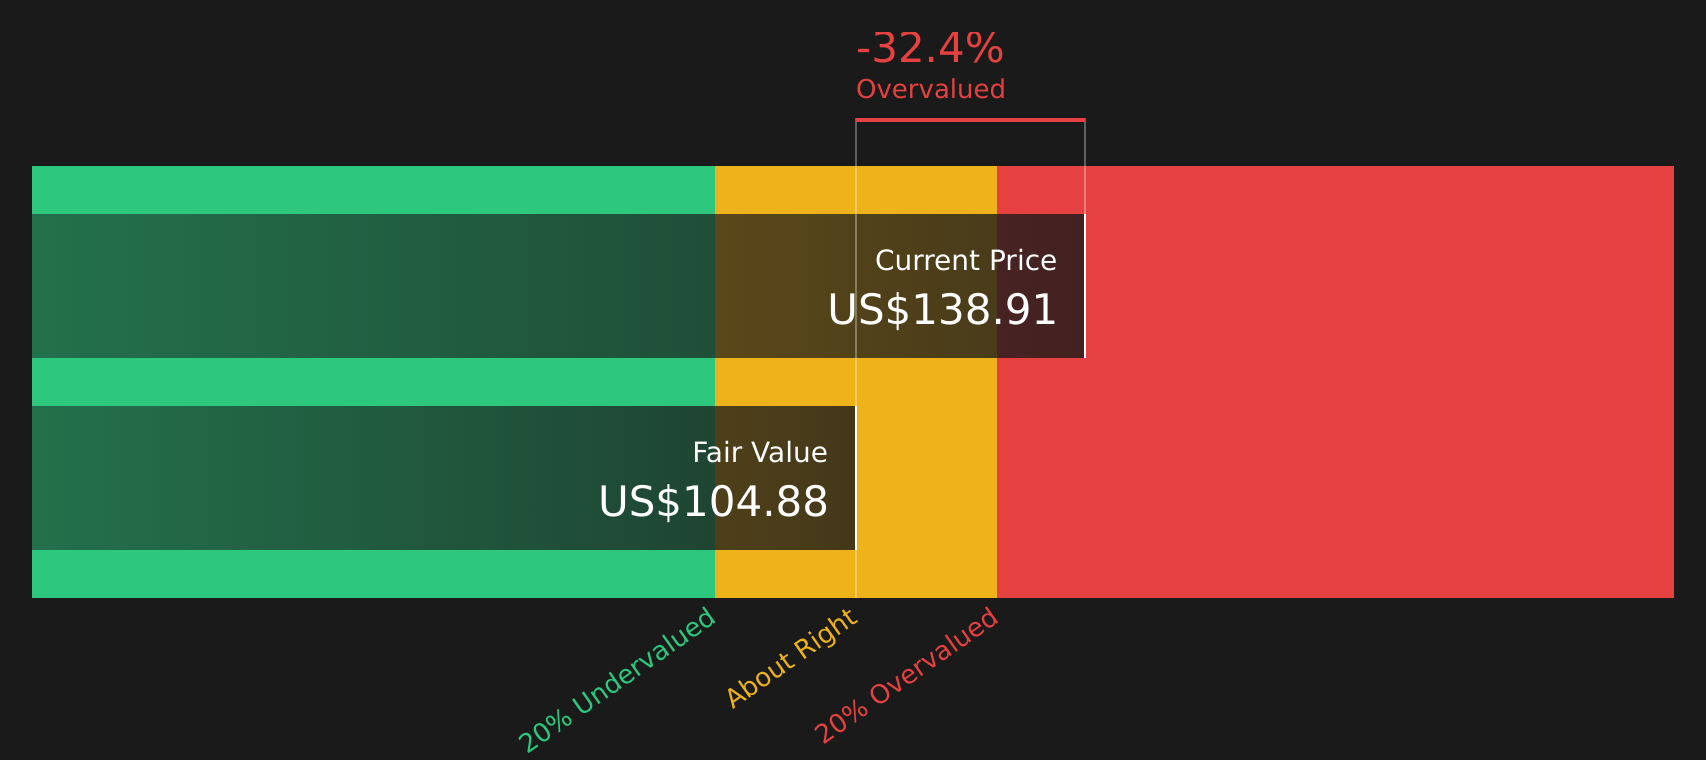
While Apollo Global Management looks expensive on a P/E of 69.1x, the SWS DCF model points in the same direction, with an estimated future cash flow value of $104.74 per share compared with the current $138.48 price. That implies Apollo Global Management stock is trading above this fair value estimate, so the question is whether you think the market has it right or the model is being too cautious.
Simply Wall St performs a discounted cash flow (DCF) on every stock in the world every day (check out Apollo Global Management for example). We show the entire calculation in full. You can track the result in your watchlist or portfolio and be alerted when this changes, or use our stock screener to discover 44 high quality undervalued stocks. If you save a screener we even alert you when new companies match - so you never miss a potential opportunity.
Next Steps
With Apollo Global Management presenting both concerns and potential upside, it makes sense to review the underlying data now and decide where you stand, starting with its 1 key reward and 3 important warning signs
Looking for more investment ideas beyond Apollo Global Management?
If Apollo Global Management has sharpened your focus on where capital could go next, do not stop here. Broaden your watchlist with fresh, targeted opportunities now.
- Spot potential breakout value by scanning 44 high quality undervalued stocks that pair stronger fundamentals with prices the market may not be fully appreciating yet.
- Strengthen your income focus by reviewing 9 dividend fortresses designed for investors who want higher yields supported by solid underlying businesses.
- Prioritise resilience by using the 67 resilient stocks with low risk scores to concentrate on companies that score better on risk while still keeping upside on the table.
This article by Simply Wall St is general in nature. We provide commentary based on historical data and analyst forecasts only using an unbiased methodology and our articles are not intended to be financial advice. It does not constitute a recommendation to buy or sell any stock, and does not take account of your objectives, or your financial situation. We aim to bring you long-term focused analysis driven by fundamental data. Note that our analysis may not factor in the latest price-sensitive company announcements or qualitative material. Simply Wall St has no position in any stocks mentioned.