Ashland (ASH) Looks Fairly Valued As Index Reshuffle Puts Its Small Cap Status In Focus
Ashland Inc. ASH | 0.00 |
Index reshuffle puts Ashland’s size and style classification in focus
Ashland (ASH) was simultaneously removed from several Russell large and mid cap indexes and added to multiple Russell 2000 and defensive or value oriented benchmarks on June 27, 2026, which has concentrated investor attention on its new small cap profile.
This type of broad index reclassification can matter for you because passive funds tracking these benchmarks often adjust their holdings around the effective date. That activity can influence trading volumes and short term price moves without any change in Ashland’s underlying business.
Ashland’s recent index reshuffle comes after a 15.50% 90 day share price return and a 31.53% 1 year total shareholder return, while the 3 and 5 year total shareholder returns are still lower. Short term momentum has improved, yet the longer term record reflects past pressure on the stock, and the reclassification has likely sharpened investors’ focus on how small cap and defensive value funds view its risk profile.
If this index move has you rethinking where you look for opportunities, it could be a good moment to scan other materials related plays using our 8 top copper producer stocks
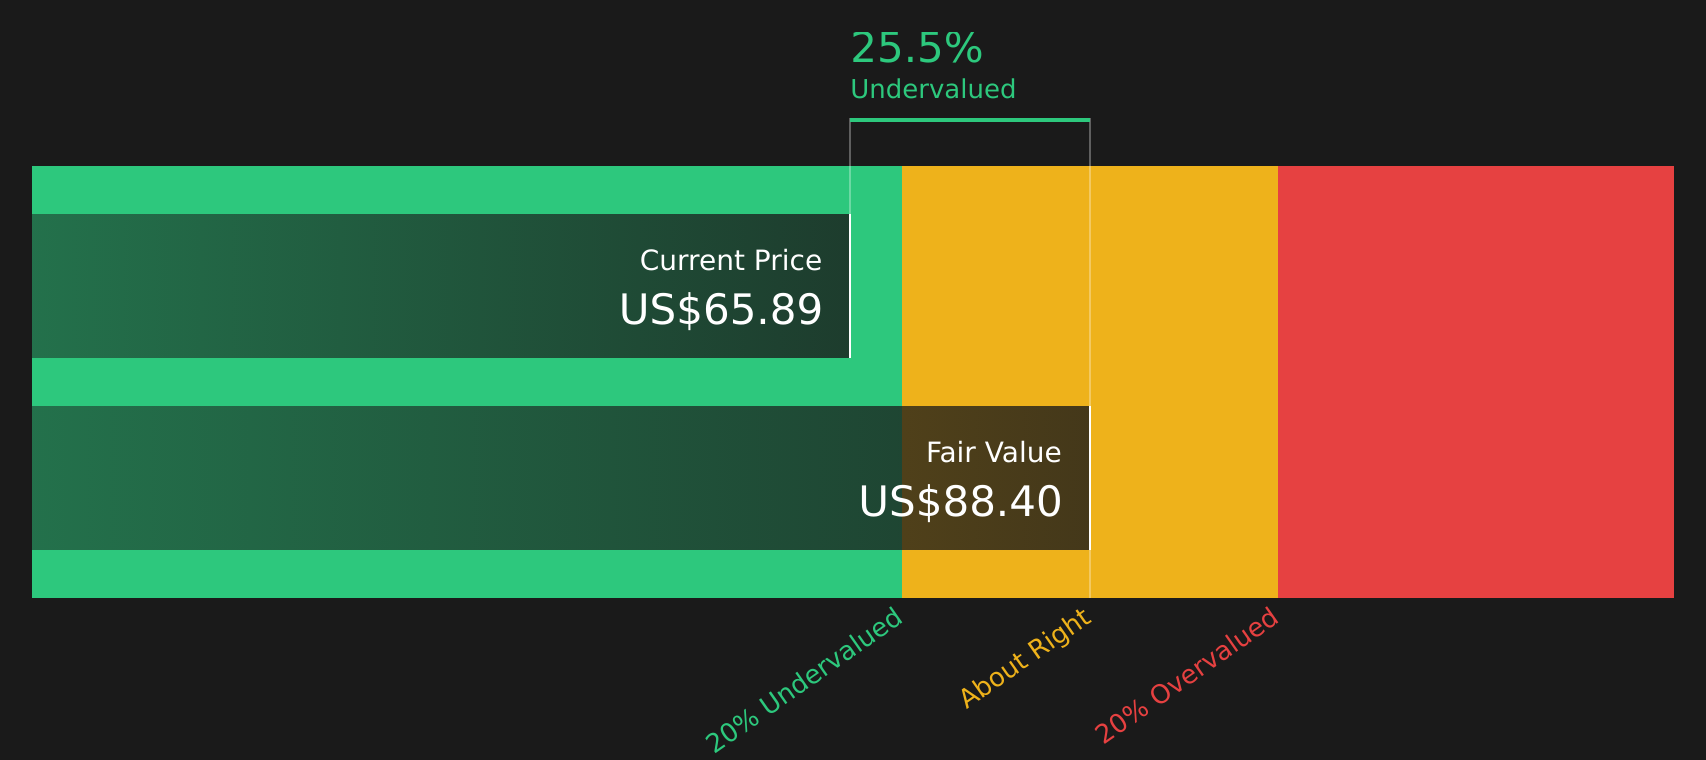
With Ashland trading at $64.23, showing a 31.53% 1 year total return alongside an indicated 27.25% intrinsic discount and a modest gap to analyst targets, investors now face a key question: is there real value left here or is the market already pricing in the company’s next phase of growth?
Most Popular Narrative: 4.5% Undervalued
The most followed narrative for Ashland puts fair value at $67.27, only modestly above the last close at $64.23, which frames the index move against a relatively tight valuation gap.
The global shift toward sustainable and bio-based materials driven by regulatory requirements and consumer preference continues to gain momentum, benefiting Ashland's specialty chemicals portfolio that is now more focused on high-value, sustainable, and compliant solutions; this is expected to support top-line revenue growth and margin resilience over the long term.
Want to see what is backing that fair value for Ashland? The narrative leans heavily on future margin rebuild, steady revenue progress, and a re rated profit multiple. Curious which assumptions really carry the model.
Result: Fair Value of $67.27 (UNDERVALUED)
However, Ashland still faces pressure from plant level disruptions and the large goodwill impairment. Both factors could challenge the upbeat margin and earnings narrative.
Another view on Ashland’s valuation
The SWS DCF model paints a different picture for Ashland. While the preferred sales based checks flag the stock as expensive on a 1.6x P/S ratio versus peers at 1.4x and an estimated fair ratio of 1.5x, the DCF output suggests the shares are undervalued based on future cash flows. Which signal do you trust more when short term sentiment swings?
Next Steps
Given the mixed signals around Ashland, do you want to rely on headlines or get closer to the source data and sentiment yourself? Take a moment to review both the caution flags and the potential upsides in one place through our 2 key rewards and 1 important warning sign
Looking for more investment ideas beyond Ashland?
If Ashland’s story has you thinking more broadly about your portfolio, do not leave it there. Use this moment to line up your next potential opportunities.
- Start sharpening your value watchlist by scanning the 42 high quality undervalued stocks that combine quality fundamentals with pricing that may still leave room for upside.
- Strengthen your income stream by reviewing the 9 dividend fortresses that pair higher yields with an emphasis on resilience.
- Get ahead of the crowd by using the screener containing 19 high quality undiscovered gems before others start paying attention to the same set of stocks.
This article by Simply Wall St is general in nature. We provide commentary based on historical data and analyst forecasts only using an unbiased methodology and our articles are not intended to be financial advice. It does not constitute a recommendation to buy or sell any stock, and does not take account of your objectives, or your financial situation. We aim to bring you long-term focused analysis driven by fundamental data. Note that our analysis may not factor in the latest price-sensitive company announcements or qualitative material. Simply Wall St has no position in any stocks mentioned.