Ashland (ASH) Stock After 30% Yearly Gain Is The Current Price Justified
Ashland Inc. ASH | 0.00 |
- Wondering if Ashland at around US$65.53 is offering fair value or if the market is getting ahead of itself? This article breaks down what the current price might really imply.
- The stock has recently moved sharply, with returns of 14.8% over the past week, 15.5% over the past month, 9.5% year to date, and 30.6% over the past year, while the return over the past 3 and 5 years shows a decline of 18.4% for each period.
- These moves come against a backdrop where investors are reassessing many materials stocks, with sentiment often shifting quickly on changing demand expectations, input costs, and corporate activity. For Ashland, this context is important because it can influence how much investors are prepared to pay for each dollar of its cash flows or assets, even when the underlying business profile appears relatively steady.
- Ashland currently has a valuation score of 2 out of 6, which suggests only part of the usual valuation checks point to the stock being undervalued. The next sections will walk through common valuation approaches and then finish with a broader way to think about what the current price really means.
Ashland scores just 2/6 on our valuation checks. See what other red flags we found in the full valuation breakdown.
Approach 1: Ashland Discounted Cash Flow (DCF) Analysis
A Discounted Cash Flow model takes estimates of a company’s future cash flows and discounts them back to today using a required rate of return, to arrive at an estimate of what the stock could be worth now.
For Ashland, the model used is a 2 Stage Free Cash Flow to Equity approach. The latest twelve month Free Cash Flow is about $166.5 million. Analyst inputs and extrapolated estimates point to Free Cash Flow of $224.3 million in 2026 and $202.6 million in 2028, with further projections out to 2035 supplied or extrapolated by Simply Wall St. All of these future cash flows are expressed in $, then discounted back to today and combined into a single value.
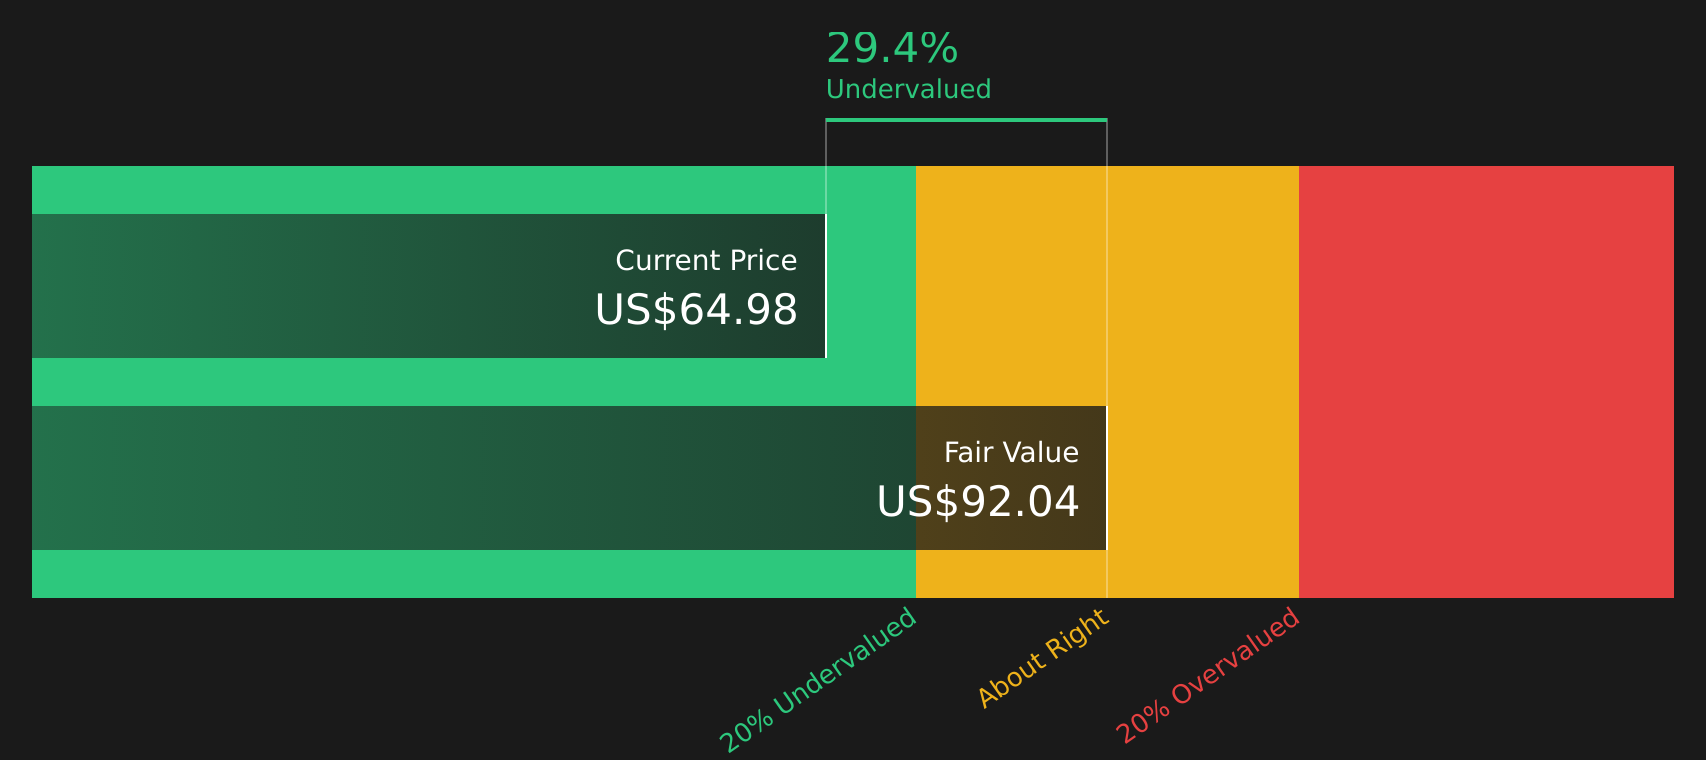
On this basis, the estimated intrinsic value from the DCF comes out at about $92.40 per share, compared with the recent share price of around $65.53. That gap implies an intrinsic discount of roughly 29.1%, suggesting Ashland stock is currently priced below this cash flow based estimate.
Result: UNDERVALUED
Our Discounted Cash Flow (DCF) analysis suggests Ashland is undervalued by 29.1%. Track this in your watchlist or portfolio, or discover 46 more high quality undervalued stocks.
Approach 2: Ashland Price vs Sales
For companies that are already generating meaningful revenue, the P/S ratio is a useful way to gauge how much investors are paying for each dollar of sales, especially when earnings can be distorted by one off items or accounting factors.
What counts as a reasonable P/S ratio usually reflects what investors expect from a company’s future growth and how much risk they see in those cash flows. Higher growth and lower perceived risk tend to support higher multiples, while slower growth or higher risk usually pull them down.
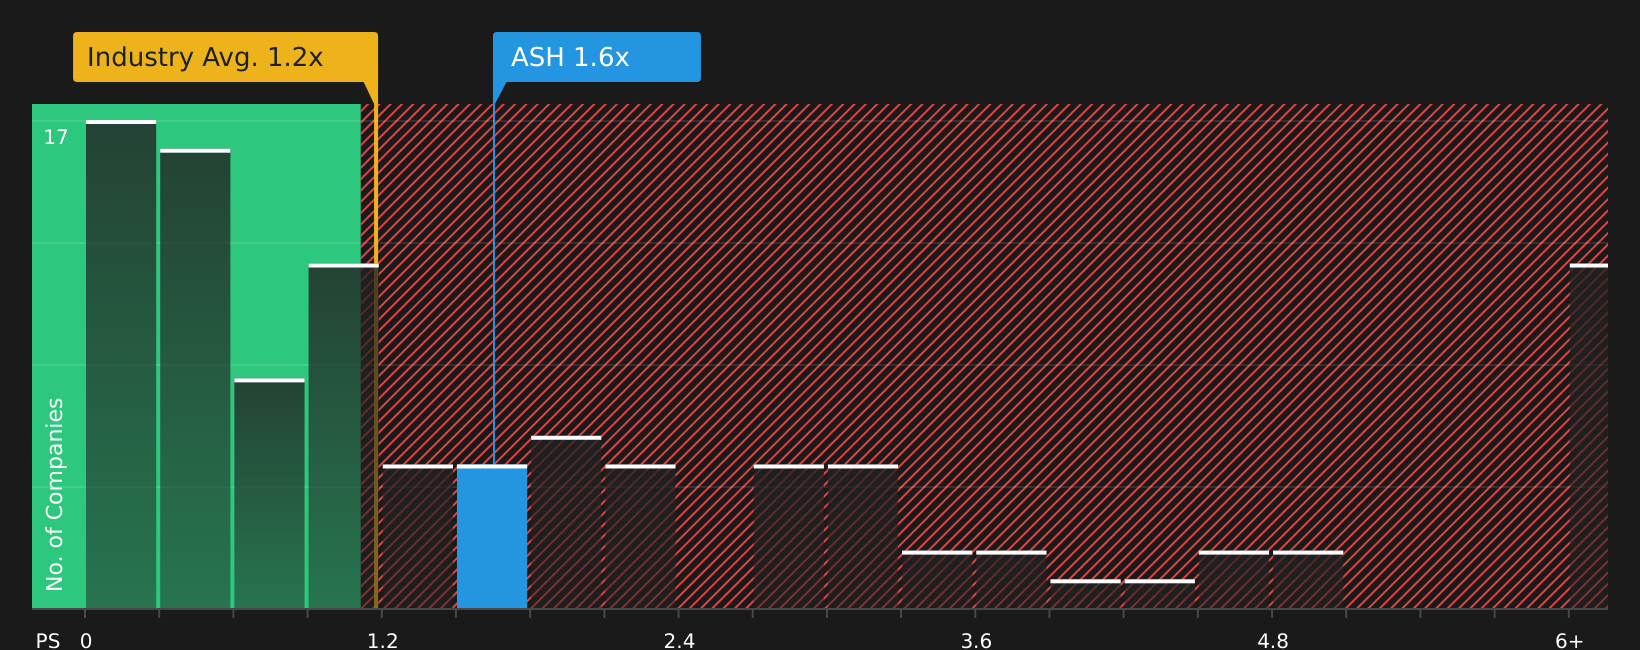
Ashland currently trades on a P/S of 1.66x. That sits above the Chemicals industry average of 1.15x and the peer average of 1.42x, so at first glance the stock is priced at a premium to many comparables.
Simply Wall St’s Fair Ratio for Ashland is 1.51x. This is a proprietary estimate of what a justified P/S might look like after accounting for factors such as earnings growth profile, industry, profit margins, market cap and company specific risks. Because it blends these fundamentals, the Fair Ratio can be more informative than a simple comparison with peers or the industry alone.
Comparing Ashland’s actual P/S of 1.66x with the Fair Ratio of 1.51x points to the stock looking slightly overvalued on this metric.
Result: OVERVALUED
Wall Street's queuing for one rocket. While SpaceX counts down to its IPO, other companies tied to the new space race are already in orbit. → 20 Compelling Space Companies watchlist · Global Space Race Investing Ideas screener · Scan the sector by valuation on Rocket Lab's valuation page.
Upgrade Your Decision Making: Choose your Ashland Narrative
Earlier it was mentioned that there is an even better way to understand valuation. Narratives on Simply Wall St let you attach a clear story about Ashland to the numbers by tying your view on its future revenue, earnings and margins to a forecast and then to a fair value. You can compare that fair value with today’s price and decide if the stock looks attractive or expensive, see how different viewpoints range from a higher fair value around US$75.00 to a lower one near US$51.07, and have your chosen Narrative update automatically as new earnings, guidance or news arrive, all within the Community page that is already used by millions of investors.
For Ashland, however, we will make it really easy for you with previews of two leading Ashland Narratives:
Fair value in this narrative: about US$67.10 per share.
At the recent price of US$65.53, this narrative views the stock as roughly 2.3% below its fair value estimate.
Revenue growth assumption in this narrative: 3.64% a year.
- Focus on higher value, more sustainable specialty chemicals and ingredients, with a large share of revenue tied to pharma and personal care customers that are typically more resilient.
- Cost savings programs and manufacturing optimisation are expected to support higher margins and stronger free cash flow over time.
- Analysts building this view assume earnings and profit margins improve from current levels, supported by product launches, share repurchases and a fair value estimate slightly above the recent share price.
Fair value in this narrative: about US$51.07 per share.
At the recent price of US$65.53, this narrative views the stock as roughly 28.4% above its fair value estimate.
Revenue growth assumption in this narrative: 3.22% a year.
- Rising regulatory and sustainability costs, plus localisation of supply chains, are expected to lift the cost base and pressure long term profitability.
- Greater exposure to cyclical and competitive markets, including regions where there is industry overcapacity, is seen as a risk for volumes, pricing and margins.
- Bearish analysts using this framework tie their view to a fair value estimate well below the recent share price, with more conservative assumptions on margins and the P/E they are willing to pay for future earnings.
If you want to see how these fair value views evolve as new data comes in, and where other investors are leaning across bull, bear and middle ground cases, it is worth checking the broader community view on Ashland through 📊 Read the what the Community is saying about Ashland..
Do you think there's more to the story for Ashland? Head over to our Community to see what others are saying!

This article by Simply Wall St is general in nature. We provide commentary based on historical data and analyst forecasts only using an unbiased methodology and our articles are not intended to be financial advice. It does not constitute a recommendation to buy or sell any stock, and does not take account of your objectives, or your financial situation. We aim to bring you long-term focused analysis driven by fundamental data. Note that our analysis may not factor in the latest price-sensitive company announcements or qualitative material. Simply Wall St has no position in any stocks mentioned.