Ashland (ASH) Stock Could Be 26.4% Below Fair Value After Recent Rally
Ashland Inc. ASH | 0.00 |
Ashland (ASH) has drawn attention after recent share price gains over the past month and past 3 months, prompting investors to reassess how its specialty chemicals mix and current valuation metrics align with its fundamentals.
At a share price of $67.92, Ashland has seen strong recent momentum, with a 30 day share price return of 20.73% and a 1 year total shareholder return of 43.33%, contrasting with weaker 3 and 5 year total shareholder returns.
If Ashland’s recent move has you rethinking where growth could come from next, it may be worth scanning the market for other specialty and materials exposure via the 8 top copper producer stocks.
With Ashland trading around $67.92 after strong recent gains, the key question is whether its specialty chemicals portfolio and current valuation still leave room for upside or if the market is already pricing in future growth.
Most Popular Narrative: 1% Overvalued
The most followed narrative currently places Ashland’s fair value close to the market price, with a fair value estimate of $67.27 against the recent $67.92 close. The gap is narrow and based on detailed forecasts rather than a large headline discount.
The global shift toward sustainable and bio-based materials driven by regulatory requirements and consumer preference continues to gain momentum, benefiting Ashland's specialty chemicals portfolio that is now more focused on high-value, sustainable, and compliant solutions; this is expected to support top-line revenue growth and margin resilience over the long term.
Want to see what that growth and margin story looks like in numbers? Revenue, earnings and future profit multiples are all tightly mapped out in this narrative.
Result: Fair Value of $67.27 (OVERVALUED)
However, Ashland still faces pressure from weaker demand in some segments and the goodwill impairment, which together raise questions about how durable any margin and earnings recovery could be.
Another View: Ashland Through Our DCF Lens
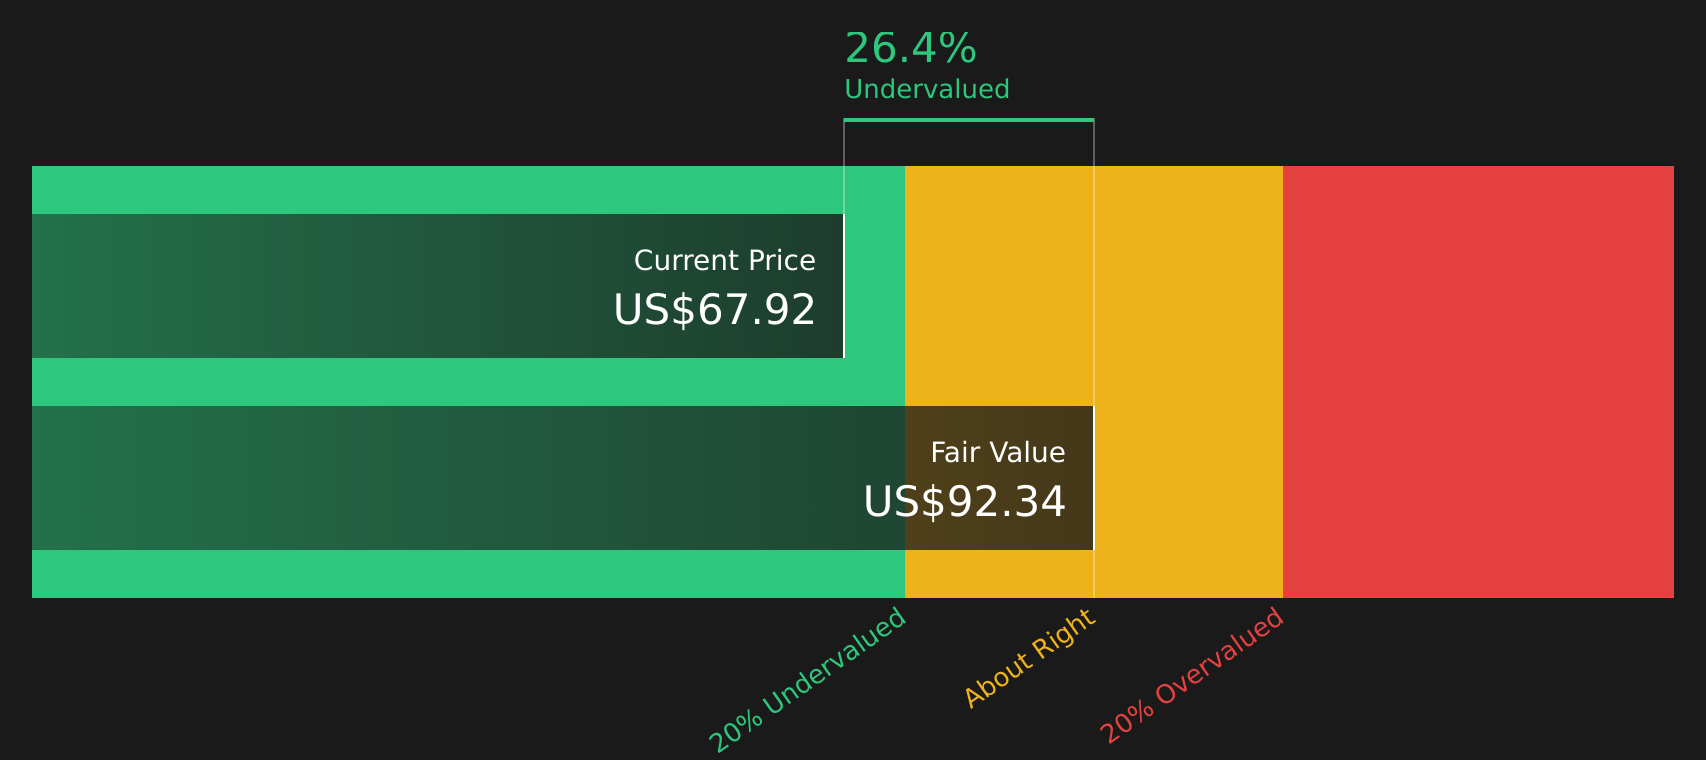
While the analyst consensus leaves Ashland looking roughly fairly valued around $67.27 per share, the SWS DCF model suggests an estimated future cash flow value of $92.34. That 26.4% gap points to a very different risk reward profile. Which set of assumptions do you trust more?
Simply Wall St performs a discounted cash flow (DCF) on every stock in the world every day (check out Ashland for example). We show the entire calculation in full. You can track the result in your watchlist or portfolio and be alerted when this changes, or use our stock screener to discover 45 high quality undervalued stocks. If you save a screener we even alert you when new companies match - so you never miss a potential opportunity.
Next Steps
If this Ashland story feels finely balanced between opportunity and concern, take a moment to review the underlying data, stress test the assumptions, and weigh the 2 key rewards and 1 important warning sign.
Looking for more investment ideas beyond Ashland?
If Ashland has sharpened your focus, do not stop here. The next step is lining up a few fresh ideas that suit your goals before the market moves on.
- Target potential bargains that combine quality and a valuation gap by scanning the 45 high quality undervalued stocks tailored to fundamentals focused investors.
- Strengthen your income stream by reviewing companies in the 8 dividend fortresses that concentrates on higher-yield stocks with a focus on resilience.
- Prioritise stability and capital protection by checking the 66 resilient stocks with low risk scores built for investors who want lower risk scores without ignoring quality.
This article by Simply Wall St is general in nature. We provide commentary based on historical data and analyst forecasts only using an unbiased methodology and our articles are not intended to be financial advice. It does not constitute a recommendation to buy or sell any stock, and does not take account of your objectives, or your financial situation. We aim to bring you long-term focused analysis driven by fundamental data. Note that our analysis may not factor in the latest price-sensitive company announcements or qualitative material. Simply Wall St has no position in any stocks mentioned.