Assessing CarGurus After Its 10% Rally and Latest Financial Outlook in 2025
CarGurus, Inc. Class A CARG | 33.45 | -0.30% |
Thinking about what to do with CarGurus stock right now? You are not alone. Whether you have watched it before or you are looking for hidden gems in the auto tech space, CarGurus has a way of catching investors’ eyes. The company’s stock has climbed an impressive 10.7% over the past year, and even more notably, it is up 156.0% over the last three years. Those long-term gains stand out, despite a 1.9% dip for the year to date and a recent 3.2% slide over the last month. Short-term fluctuations happen, but CarGurus’ journey from disruptor to established force in online car sales has been fueled by broad trends in digital retail and growing trust in its platform.
It is not just momentum driving curiosity here. Valuation matters, especially with the market’s shifting appetite for tech and retail stocks. If you are wondering how the numbers stack up, CarGurus currently has a valuation score of 2 out of 6, suggesting it is undervalued in two out of six checks. That may raise an eyebrow or two for value-focused investors who are looking for a margin of safety amid the growth story.
Should you see CarGurus as an opportunity or proceed with caution? The answer depends a lot on how you approach valuation. In the next section, we will dig into the different methods for sizing up the company’s value. Stick around, because there is an even more insightful perspective on valuation that is often overlooked.
CarGurus scores just 2/6 on our valuation checks. See what other red flags we found in the full valuation breakdown.
Approach 1: CarGurus Discounted Cash Flow (DCF) Analysis
The Discounted Cash Flow (DCF) model estimates a company's intrinsic value by projecting its future cash flows and discounting them back to today's value. This approach essentially asks what all those expected dollars are worth in today's money. For CarGurus, this model uses a 2 Stage Free Cash Flow to Equity approach, which starts with analyst-provided forecasts and then extends those projections beyond the analyst horizon.
Currently, CarGurus generates free cash flow of $223.7 million. Looking ahead, analysts forecast steadily increasing cash flows, with projections reaching $327.1 million by 2027. After that, the estimates are extrapolated out, with free cash flow expected to reach $798.6 million by 2035, according to Simply Wall St’s calculations. All cash flow figures are expressed in US dollars.
Based on the DCF model, the estimated intrinsic fair value for CarGurus stock is $116.54 per share. This is significantly above the company’s current market price, implying the stock is trading at a 69.9% discount to its estimated value, making it appear strongly undervalued according to this methodology.
Result: UNDERVALUED
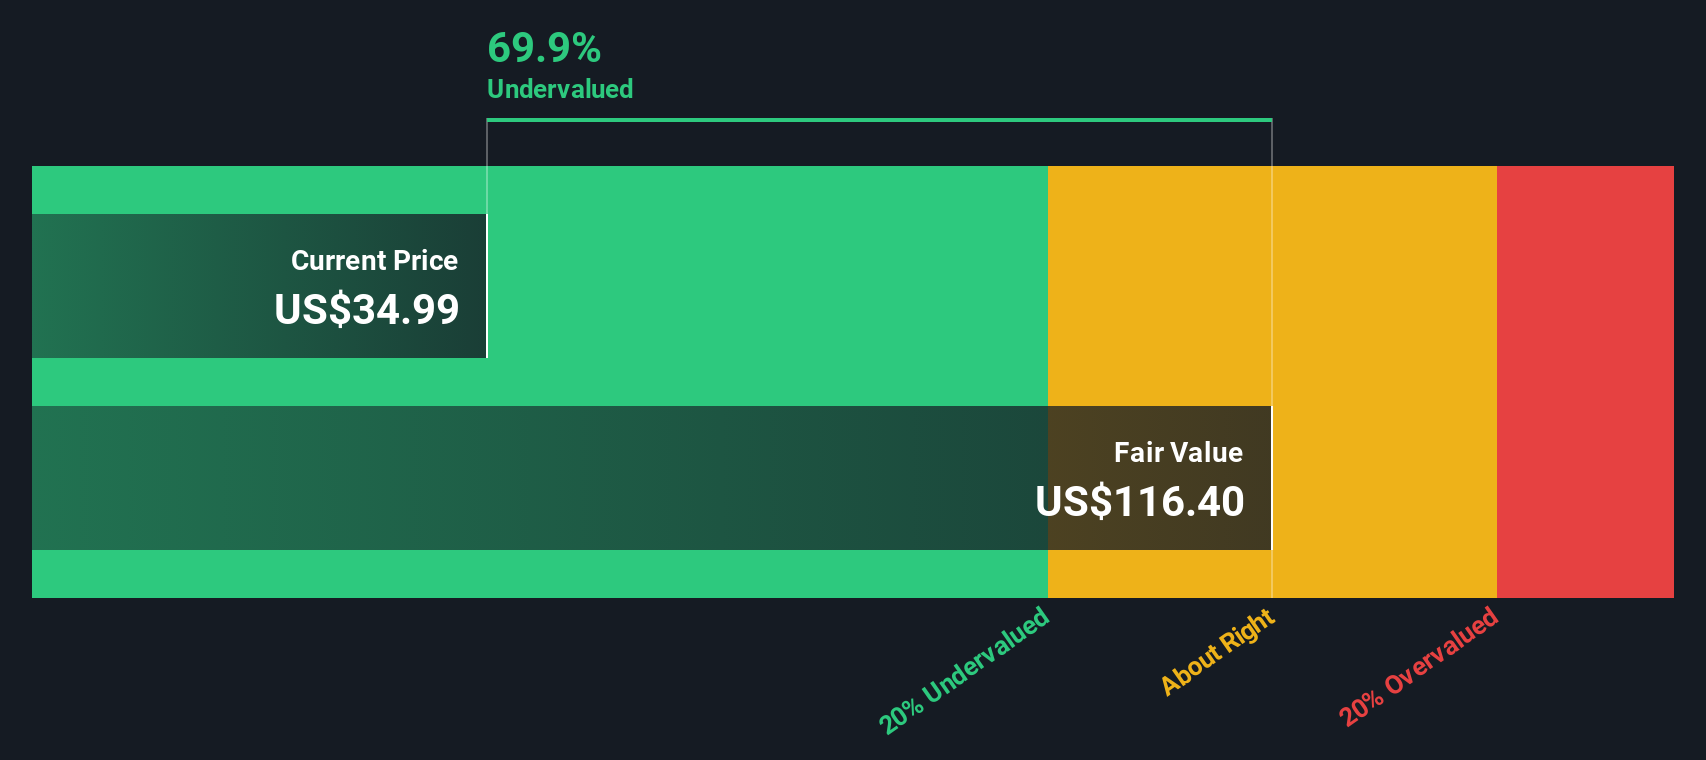
Our Discounted Cash Flow (DCF) analysis suggests CarGurus is undervalued by 69.9%. Track this in your watchlist or portfolio, or discover more undervalued stocks.
Approach 2: CarGurus Price vs Earnings
For profitable companies like CarGurus, the Price-to-Earnings (PE) ratio is a widely used and trusted valuation metric. It helps investors assess how much the market is willing to pay for each dollar of the company's earnings, shining a light on both opportunity and risk. Generally, higher expected growth and lower perceived risk justify a higher PE ratio, while slower growth or added risk tend to push the fair value lower.
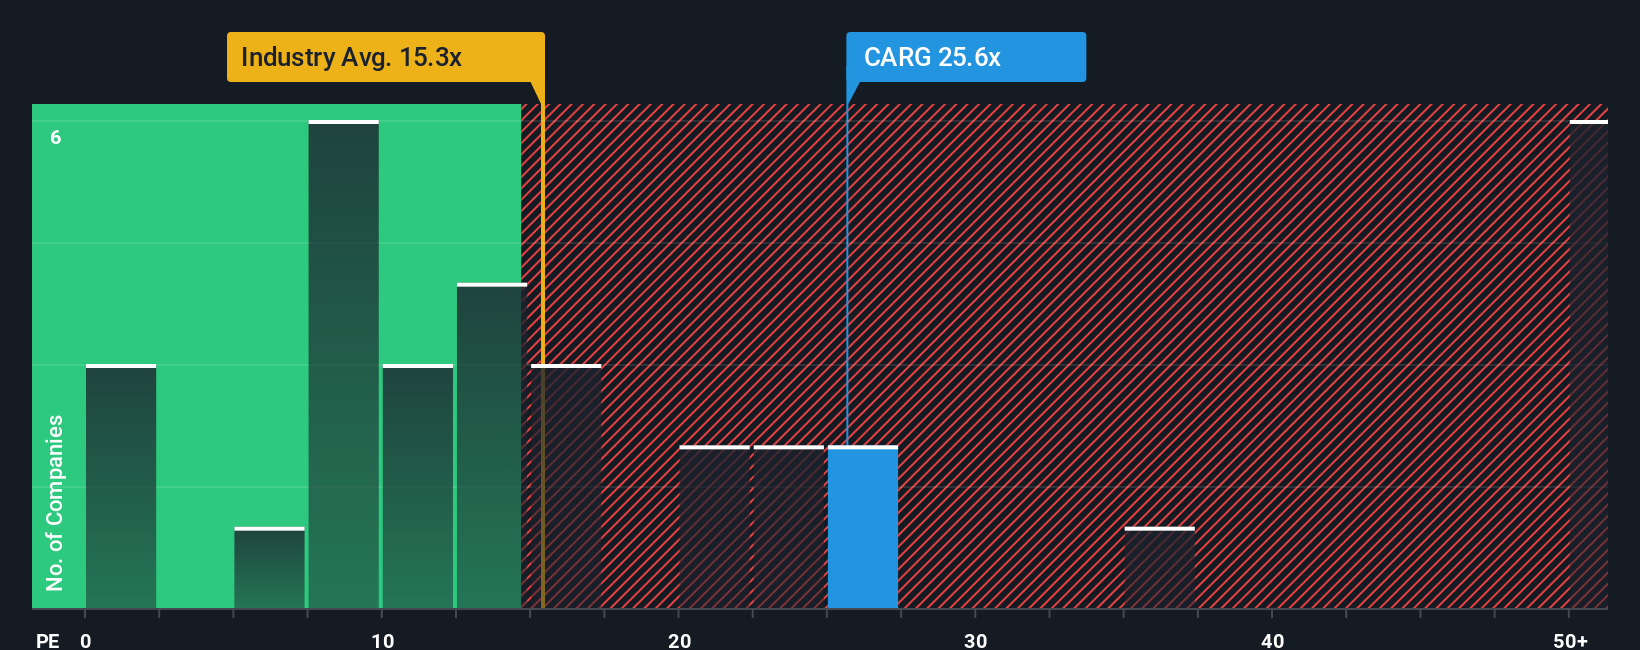
At the moment, CarGurus trades on a 26.8x PE ratio. How does this stack up? The sector average for Interactive Media and Services sits at 15.9x, and the average among listed peers is about 15.4x. Clearly, the market is valuing CarGurus at a notable premium. However, not all companies have the same growth trajectory or risk profile, so these comparisons only tell half the story.
This is where Simply Wall St’s “Fair Ratio” comes in. The Fair Ratio, at 23.6x for CarGurus, reflects a tailored benchmark that factors in the company’s earnings growth outlook, profitability, market cap, and inherent risks. By going beyond blunt peer and industry averages, the Fair Ratio gives a more complete and nuanced view of fair value for the stock’s unique characteristics.
Comparing CarGurus’ actual PE ratio of 26.8x against the Fair Ratio of 23.6x, the stock appears somewhat overvalued by this measure. While not extreme, the premium suggests investors are paying up for future growth or assigning a higher degree of confidence in the company’s story.
Result: OVERVALUED
PE ratios tell one story, but what if the real opportunity lies elsewhere? Discover companies where insiders are betting big on explosive growth.
Upgrade Your Decision Making: Choose your CarGurus Narrative
Earlier we mentioned that there is an even better way to understand valuation. Let us introduce you to Narratives. Narratives are your unique lens for investing, allowing you to connect your perspective on a company’s story, such as its future revenue, earnings, and margins, with a financial forecast and a calculated fair value. Instead of simply relying on static models or a single consensus, Narratives make it easy for anyone to sketch their outlook, compare it to others, and see right away how that story translates into buy or sell decisions by weighing Fair Value against the current Price.
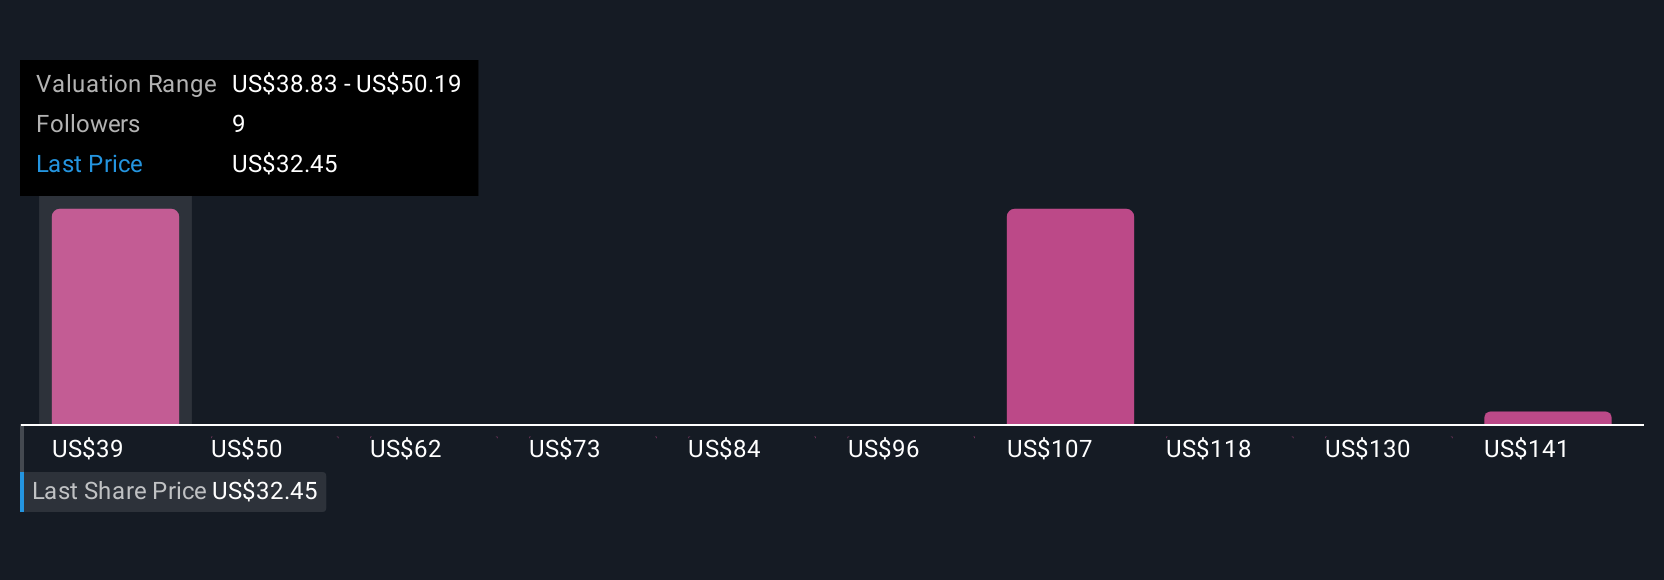
Available to millions of investors right on Simply Wall St’s Community page, Narratives are designed to be user-friendly and update dynamically with new news or earnings so your view always stays relevant. For CarGurus, one investor might highlight AI-driven expansion and international growth, resulting in a bullish price target of $44.00. Another might focus on risks from increased competition and limited overseas reach, projecting a lower value of $33.00. Narratives let you take ownership of your investment logic, see how your thesis stacks up, and adapt quickly as new facts emerge.
Do you think there's more to the story for CarGurus? Create your own Narrative to let the Community know!
This article by Simply Wall St is general in nature. We provide commentary based on historical data and analyst forecasts only using an unbiased methodology and our articles are not intended to be financial advice. It does not constitute a recommendation to buy or sell any stock, and does not take account of your objectives, or your financial situation. We aim to bring you long-term focused analysis driven by fundamental data. Note that our analysis may not factor in the latest price-sensitive company announcements or qualitative material. Simply Wall St has no position in any stocks mentioned.