Assessing Crane (CR) (CR) Valuation After Strong Results And Positive Growth Outlook
Crane Company CR | 193.79 193.79 | +2.83% 0.00% Pre |
Crane (CR) is back in focus after a quarterly operating update that detailed segment performance, manufacturing efficiency, and a routine distribution announcement, prompting investors to reassess the stock following a strong multiyear total return profile.
At a share price of $200.52, Crane’s 90 day share price return of 11.72% and year to date share price return of 6.93% sit alongside a 1 year total shareholder return of 17.54% and very strong multi year total shareholder returns. This suggests that momentum has been building rather than fading.
If Crane’s recent update has you thinking about where else growth and execution might show up next, it could be worth scanning our 25 power grid technology and infrastructure stocks as a starting list of ideas.
With Crane trading at $200.52, an intrinsic value estimate that sits at a small premium to the current price suggests limited cushion. The key question is whether this still represents an attractive entry point or if markets are already pricing in future growth.
Most Popular Narrative: 6.4% Undervalued
With Crane closing at $200.52 and the most followed narrative pointing to a fair value of $214.22, the gap reflects specific growth and margin assumptions that go well beyond the latest quarter.
Crane's recent acquisition of PSI (Druck, Panametrics, Reuter-Stokes) positions the company to capture rising demand for advanced sensing and fluid control in both aerospace and process industries, directly benefiting from infrastructure modernization and growing automation, supporting sustained revenue and future margin expansion.
Curious what earnings profile and margin runway need to hold up for that fair value to make sense? The narrative leans on higher growth, firmer profitability, and a richer future earnings multiple. The full story ties those pieces together in a way the share price alone does not show.
Result: Fair Value of $214.22 (UNDERVALUED)
However, this hinges on Crane absorbing PSI cleanly and avoiding prolonged weakness or project delays in European chemicals, which could unsettle the Process Flow Technologies story.
Another Take On Value
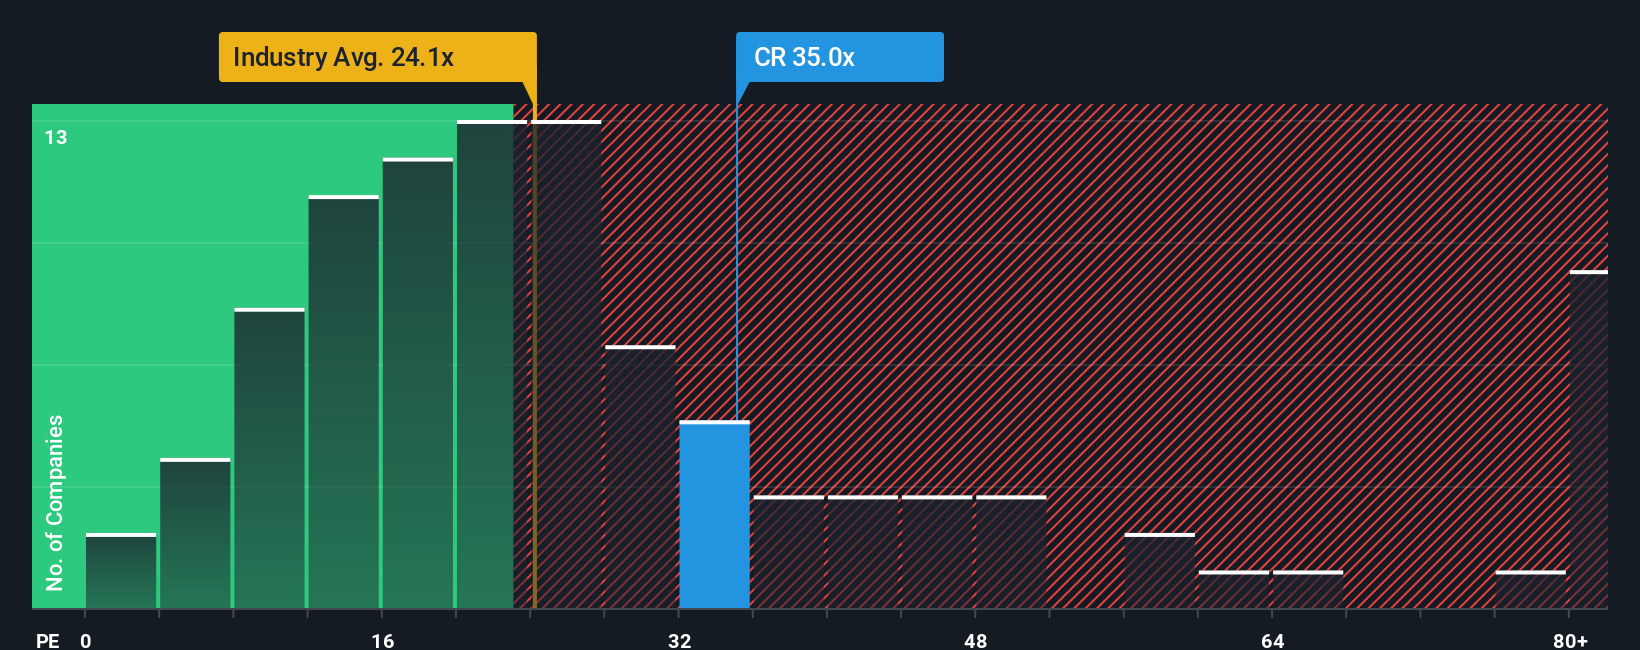
There is a catch. Crane trades on a P/E of 34.8x, above the US Machinery average of 29.9x, and higher than its own fair ratio of 27.2x. That premium points to optimism already in the price, so the question is whether earnings can keep justifying it.
Simply Wall St performs a discounted cash flow (DCF) on every stock in the world every day (check out Crane for example). We show the entire calculation in full. You can track the result in your watchlist or portfolio and be alerted when this changes, or use our stock screener to discover 54 high quality undervalued stocks. If you save a screener we even alert you when new companies match - so you never miss a potential opportunity.
Build Your Own Crane Narrative
If you look at these numbers and reach a different conclusion, or simply want to test your own assumptions step by step, you can build a custom view of Crane in minutes, starting with Do it your way.
A good starting point is our analysis highlighting 2 key rewards investors are optimistic about regarding Crane.
Looking for more investment ideas?
Once you have formed a view on Crane, do not stop there. Widen your net with a few focused stock ideas tailored to different investing goals.
- Target potential mispricing by checking companies our screener flags as 54 high quality undervalued stocks that pair quality fundamentals with pricing that may not fully reflect them.
- Strengthen your income stream by reviewing our hand picked 13 dividend fortresses that combine higher yields with a focus on resilience.
- Sleep a little easier by scanning 83 resilient stocks with low risk scores that our models score as having relatively lower overall risk profiles.
This article by Simply Wall St is general in nature. We provide commentary based on historical data and analyst forecasts only using an unbiased methodology and our articles are not intended to be financial advice. It does not constitute a recommendation to buy or sell any stock, and does not take account of your objectives, or your financial situation. We aim to bring you long-term focused analysis driven by fundamental data. Note that our analysis may not factor in the latest price-sensitive company announcements or qualitative material. Simply Wall St has no position in any stocks mentioned.