Assessing Enterprise Financial Services (EFSC) Valuation As Options Activity Rises Before Q1 2026 Earnings
Enterprise Financial Services Corp EFSC | 0.00 |
Options traders are zeroing in on Enterprise Financial Services (EFSC) as implied volatility climbs ahead of its first quarter 2026 earnings release, a setup that often reflects expectations for a meaningful price swing.
At a share price of $57.87, Enterprise Financial Services has seen a 7.1% year to date share price return and a 28.1% total shareholder return over the past year. This suggests momentum has been building despite a 2.0% one day pullback.
If you are watching how interest around EFSC is picking up ahead of earnings, it can be a useful time to scan the market for other banks with similar profiles, starting with a 18 top founder-led companies
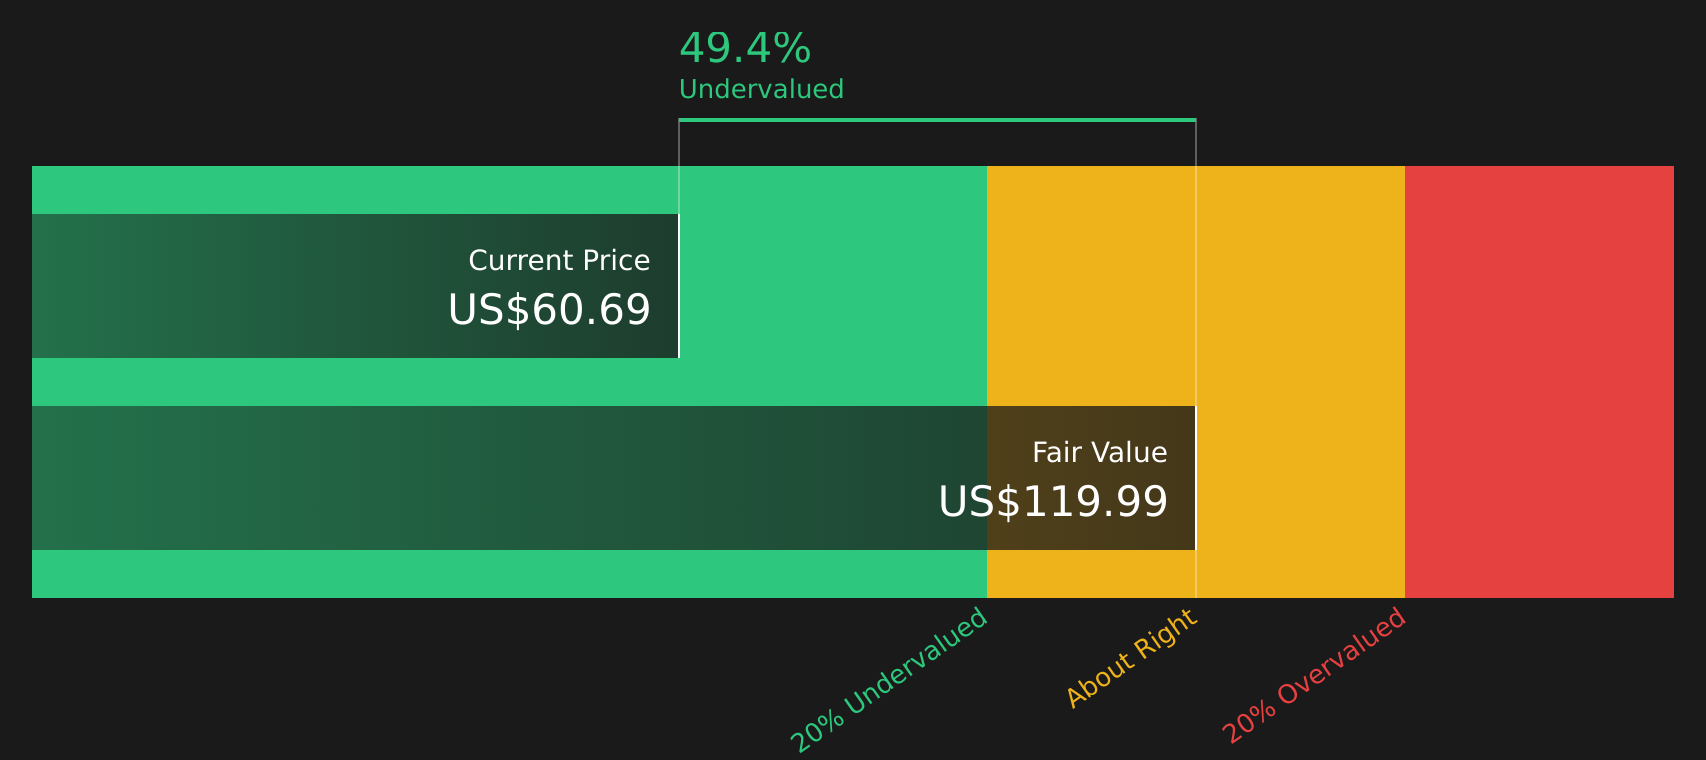
With EFSC trading at $57.87 alongside a 55.3% modeled intrinsic discount and a 13.2% gap to analyst targets, you have to ask: is the stock still undervalued, or is the market already pricing in future growth?
Price-to-Earnings of 10.8x: Is it justified?
On a P/E of 10.8x, Enterprise Financial Services trades below both its peer average of 13.6x and the broader US Banks industry at 11.9x, even after the recent share price gains.
The P/E ratio tells you how much investors are currently paying for each dollar of EFSC's earnings, which matters for a profitable bank with a $197.6m net income base and high quality earnings. With earnings forecast to grow at a modest 4.9% per year, a lower P/E can indicate the market is not paying a premium for that growth.
Against peers and the sector, the discount is clear. The current P/E also lines up with the estimated fair P/E of 10.8x, which suggests the current level is exactly in line with where the market could reasonably settle if sentiment stays unchanged.
Result: Price-to-Earnings of 10.8x (ABOUT RIGHT)
However, there are still risks, including potential credit losses across EFSC's commercial loan book and any shift in deposit costs that compresses its current earnings base.
Another View: What the SWS DCF Model Says
While the 10.8x P/E points to EFSC being fairly priced against peers, the SWS DCF model tells a different story. With an estimated future cash flow value of $129.43 per share versus the current $57.87 price, the model suggests EFSC is trading at a steep discount. The question is whether you trust today’s earnings multiple or the long term cash flow picture more.
Simply Wall St performs a discounted cash flow (DCF) on every stock in the world every day (check out Enterprise Financial Services for example). We show the entire calculation in full. You can track the result in your watchlist or portfolio and be alerted when this changes, or use our stock screener to discover 58 high quality undervalued stocks. If you save a screener we even alert you when new companies match - so you never miss a potential opportunity.
Next Steps
The mix of fair value signals and options activity raises real questions. If this stock is on your radar, move quickly and test the numbers yourself, then weigh those findings against the 5 key rewards
Looking for more investment ideas?
If EFSC has caught your attention, do not stop here. Use the Screener to scan for other focused ideas that match your goals before the market moves on.
- Target resilience by checking companies with strong finances through the solid balance sheet and fundamentals stocks screener (41 results)
- Hunt for value by reviewing companies that screen well on quality and price using the 58 high quality undervalued stocks
- Prioritize income by searching for higher yielding opportunities through the 11 dividend fortresses
This article by Simply Wall St is general in nature. We provide commentary based on historical data and analyst forecasts only using an unbiased methodology and our articles are not intended to be financial advice. It does not constitute a recommendation to buy or sell any stock, and does not take account of your objectives, or your financial situation. We aim to bring you long-term focused analysis driven by fundamental data. Note that our analysis may not factor in the latest price-sensitive company announcements or qualitative material. Simply Wall St has no position in any stocks mentioned.