Assessing Enterprise Financial Services (EFSC) Valuation With P/E And DCF Pointing To Undervalued Shares
Enterprise Financial Services Corp EFSC | 0.00 |
Recent performance snapshot
Enterprise Financial Services (EFSC) has drawn attention after recent share price moves, with the stock closing at US$58.99 and posting mixed short term returns alongside stronger outcomes over longer holding periods.
Recent trading has been a bit soft, with the 1-day share price return down 2.91% and the 7-day share price return down 2.67%. However, a 9.14% year to date share price return and a 16.25% 1-year total shareholder return indicate that momentum remains skewed toward longer term holders.
If you are weighing EFSC alongside other opportunities in financials and beyond, it can help to widen the net and scan a curated set of 20 top founder-led companies
With Enterprise Financial Services trading at US$58.99, an indicated 51% discount to one intrinsic value estimate and an 11% gap to analyst targets, you have to ask: is there a mispricing here, or is the market already looking ahead?
Preferred P/E of 11x: Is it justified?
On a simple yardstick, Enterprise Financial Services is on a P/E of 11x at a share price of $58.99, which screens as good value against both peers and its own estimated fair P/E.
The P/E ratio compares the current share price with earnings per share, giving you a quick sense of what the market is willing to pay for each dollar of profit. For a bank like EFSC, where earnings and return on equity are central, P/E is a common way investors line the stock up against other financial institutions.
Here, EFSC screens as good value in several ways. It trades on 11x earnings compared with a peer average P/E of 13.4x and a US Banks industry average of 11.5x, suggesting the market is pricing EFSC below similar companies. At the same time, that 11x P/E aligns with an estimated fair P/E of 11x, pointing to a level the market could converge around if sentiment and earnings expectations stay on a similar footing.
Result: Preferred multiple of Price-to-Earnings of 11x (UNDERVALUED)
However, softer recent share price returns and EFSC’s focus on commercial and real estate lending could leave the stock sensitive to shifts in credit quality or funding costs.
Another view on value: cash flows paint a different picture
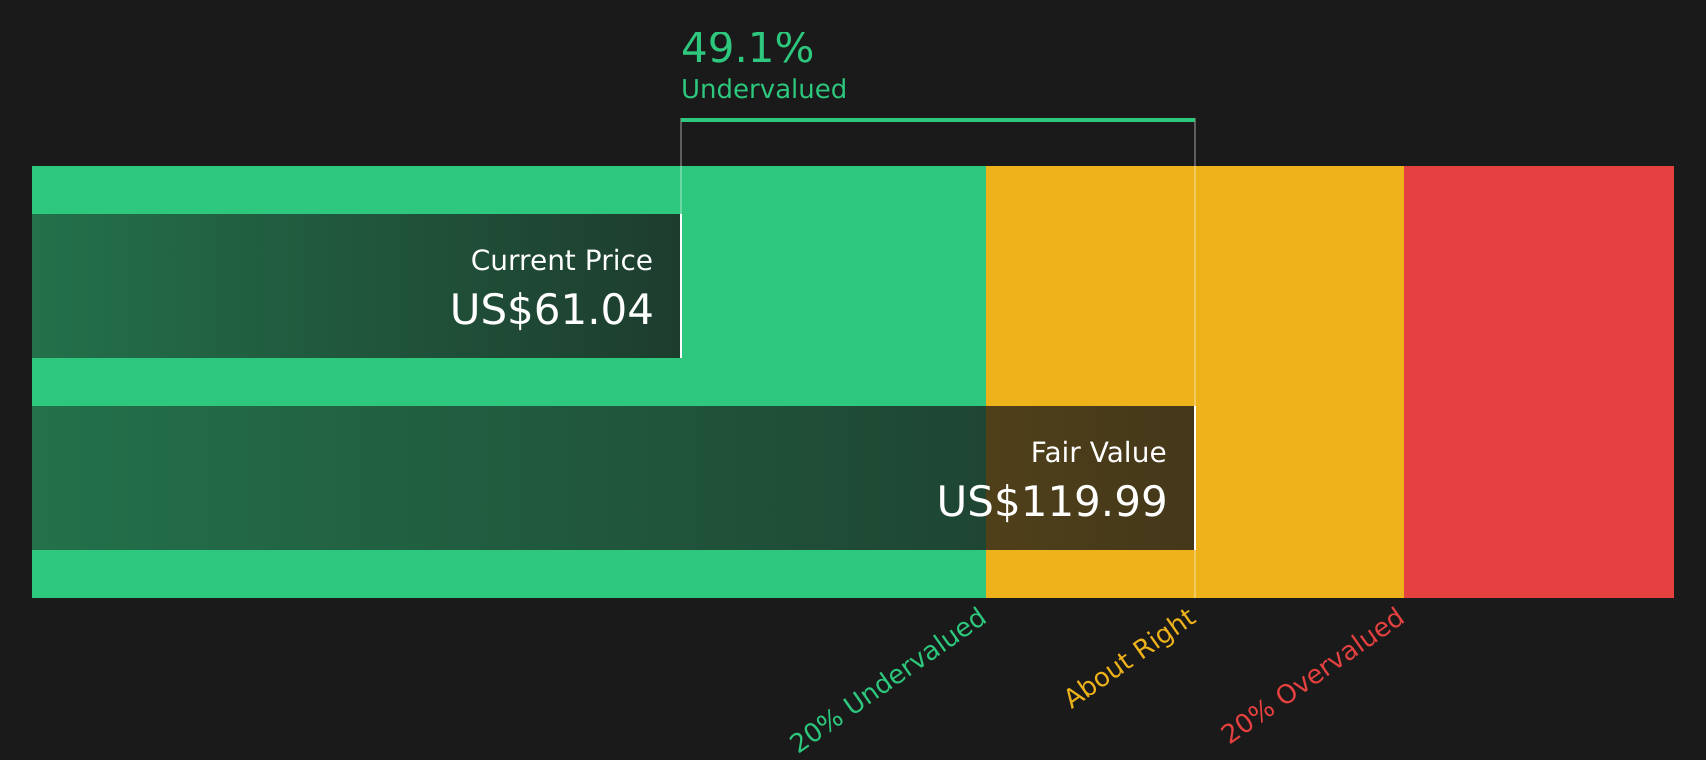
While the current P/E of 11x suggests Enterprise Financial Services is roughly in line with a fair ratio of 11x, the SWS DCF model points to something very different. It shows an estimated future cash flow value of $119.99 versus the current $58.99 share price, implying the stock screens as undervalued on this method. Which lens do you trust more when those signals disagree so sharply?
Simply Wall St performs a discounted cash flow (DCF) on every stock in the world every day (check out Enterprise Financial Services for example). We show the entire calculation in full. You can track the result in your watchlist or portfolio and be alerted when this changes, or use our stock screener to discover 47 high quality undervalued stocks. If you save a screener we even alert you when new companies match - so you never miss a potential opportunity.
Next Steps
Given the mix of valuation signals so far, it makes sense to move quickly and test the numbers against your own expectations. To see what optimistic investors are focusing on, review the 5 key rewards
Looking for more investment ideas?
If EFSC has caught your attention, do not stop there. Cast a wider net and let a focused stock screener surface ideas you might otherwise miss.
- Target compact opportunities with strong financials by scanning 24 elite penny stocks with strong financials that already clear strict balance sheet and quality filters.
- Hunt for potential bargains by reviewing 47 high quality undervalued stocks that pair healthy fundamentals with prices that still sit below certain fair value estimates.
- Prioritise resilience by spotting 63 resilient stocks with low risk scores where business stability scores well on key risk checks.
This article by Simply Wall St is general in nature. We provide commentary based on historical data and analyst forecasts only using an unbiased methodology and our articles are not intended to be financial advice. It does not constitute a recommendation to buy or sell any stock, and does not take account of your objectives, or your financial situation. We aim to bring you long-term focused analysis driven by fundamental data. Note that our analysis may not factor in the latest price-sensitive company announcements or qualitative material. Simply Wall St has no position in any stocks mentioned.