Assessing First Busey (BUSE) Valuation After Its Recent Share Price Momentum
First Busey Corporation BUSE | 0.00 |
Why First Busey Is On Investors’ Radar Today
First Busey (BUSE) is drawing attention after fresh performance figures put its recent returns and profitability in focus, prompting investors to reassess how the regional bank stock fits into their portfolios.
At a share price of $26.61, First Busey has seen a 1-month share price return of 3.90% and an 11.34% year to date share price return, while the 1-year total shareholder return of 27.84% points to momentum that has been building over a longer period.
If this kind of steady regional bank performance has your attention, it could be a good moment to broaden your watchlist with 17 top founder-led companies
With First Busey trading at $26.61, an estimated 48.08% intrinsic discount and only a 7.37% gap to its analyst price target raise a key question: is there still a buying opportunity here, or is the market already pricing in future growth?
Preferred P/E of 11.3x: Is It Justified?
First Busey currently trades on a P/E of 11.3x, which sits below both its peer average of 13.5x and very close to an estimated fair P/E of 11.4x.
The P/E ratio compares the current share price with earnings per share, so it gives you a quick sense of how much investors are paying for each dollar of profit. For a regional bank with earnings growth forecasts and a long operating history, this yardstick is a straightforward way to compare pricing against other banks and the wider market.
At this level, the stock is described as good value compared with peers and the broader US Banks industry. This suggests the market price is not assigning a premium to its recent earnings rebound. With the fair P/E estimate almost identical to the current P/E, the ratio is also close to where regression based analysis suggests it could settle if sentiment and fundamentals stay aligned.
Compared with the US Banks industry average P/E of 11.4x, First Busey comes across as slightly cheaper, which hints that recent earnings strength is not being fully reflected. Against the peer group average of 13.5x, the discount looks clearer and highlights that similar banks are being valued more highly for each dollar of earnings, while the fair ratio work points to limited stretch in the current multiple.
Result: Price-to-earnings of 11.3x (UNDERVALUED)
However, you still need to weigh up risks such as pressure on regional banks’ funding costs and any shift in credit quality across First Busey’s loan book.
Another Way To Look At Value
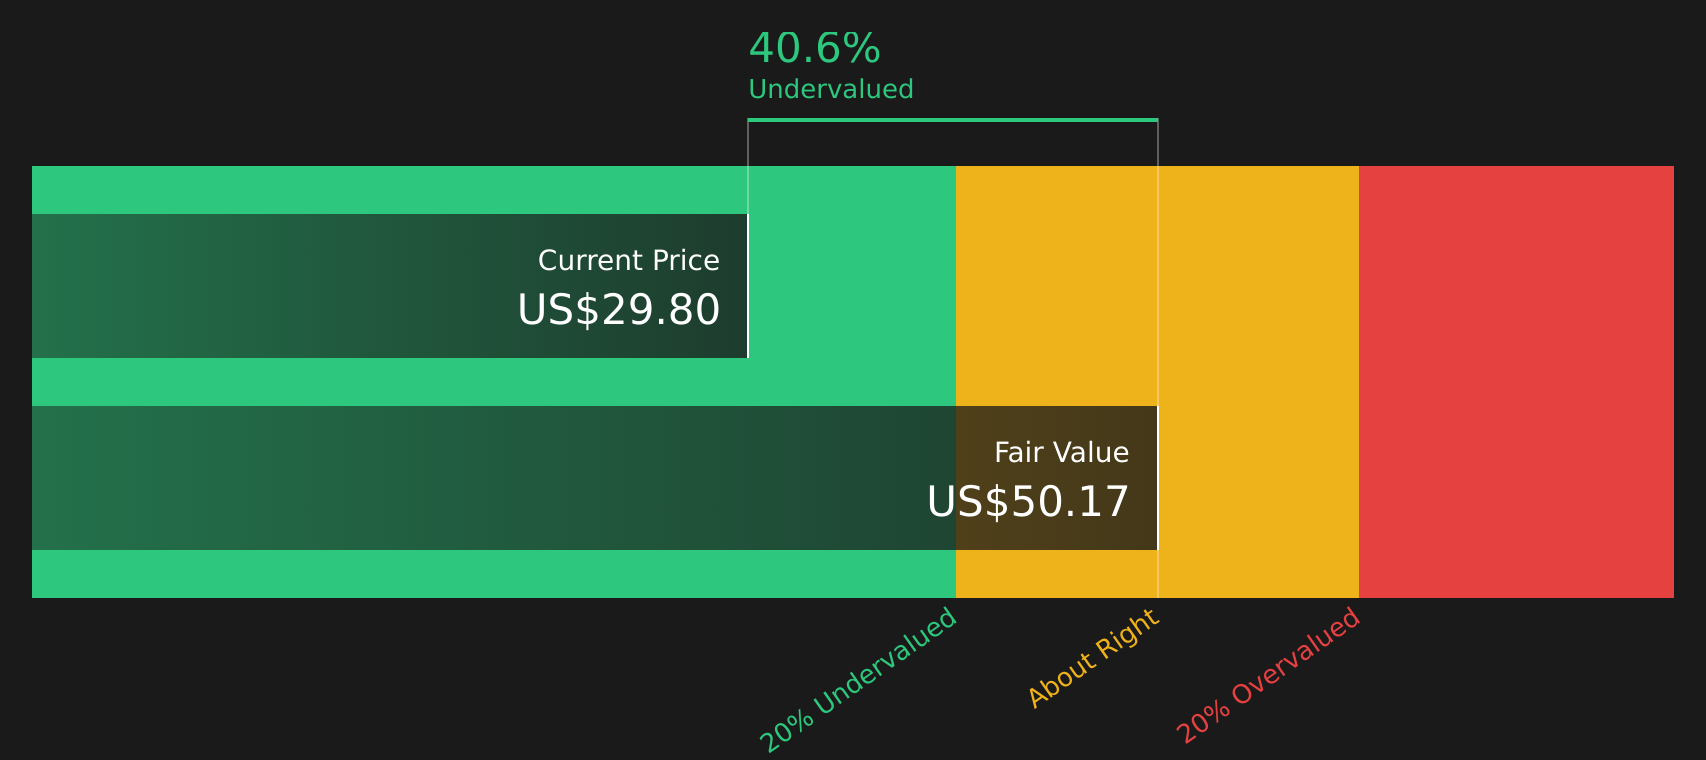
The P/E comparison presents First Busey as good value, while the SWS DCF model appears even more generous, with an estimated future cash flow value of $51.25 per share versus the current $26.61 price. This wide gap raises the question of which signal may be more informative.
Simply Wall St performs a discounted cash flow (DCF) on every stock in the world every day (check out First Busey for example). We show the entire calculation in full. You can track the result in your watchlist or portfolio and be alerted when this changes, or use our stock screener to discover 51 high quality undervalued stocks. If you save a screener we even alert you when new companies match - so you never miss a potential opportunity.
Next Steps
Does this setup feel promising to you, or more cautious? Act quickly, review the full picture yourself, and weigh the stock’s 5 key rewards with 5 key rewards
Ready To Uncover More Investment Ideas?
If First Busey has sharpened your interest, do not stop here, use the Simply Wall Street Screener to hunt for other stocks that fit your style.
- Target resilience and stability by scanning for 71 resilient stocks with low risk scores that could help balance more aggressive positions in your portfolio.
- Spot potential value opportunities early by reviewing screener containing 25 high quality undiscovered gems before they attract broader market attention.
- Focus on quality and financial strength by filtering through the solid balance sheet and fundamentals stocks screener (44 results) to see which companies match your risk comfort.
This article by Simply Wall St is general in nature. We provide commentary based on historical data and analyst forecasts only using an unbiased methodology and our articles are not intended to be financial advice. It does not constitute a recommendation to buy or sell any stock, and does not take account of your objectives, or your financial situation. We aim to bring you long-term focused analysis driven by fundamental data. Note that our analysis may not factor in the latest price-sensitive company announcements or qualitative material. Simply Wall St has no position in any stocks mentioned.