

Assessing FuboTV (FUBO) Valuation After Steep Share Price Weakness And Discounted Sales Multiple
FuboTV FUBO | 0.00 |
Recent performance snapshot
FuboTV (FUBO) has been on many watchlists after a challenging stretch for the stock, including declines over the past month, past 3 months, year to date, and over the past year.
At a recent close of US$10.09 and a market value of about US$1.1b, the company sits at an interesting point for investors who are assessing how its live TV streaming focus and current financial profile fit their risk tolerance.
Short term momentum has been mixed, with a 7 day share price return of 3.5% but a 30 day share price return down 14.9%, and a 1 year total shareholder return down 77.0%, which may indicate weakening confidence in the story so far.
If FuboTV's recent swings have you considering where else growth and risk might align with your preferences, it could be worth scanning 20 top founder-led companies
With FuboTV’s share price under pressure despite revenue growth and a recent analyst price target above the market, investors face a key question: is the stock undervalued, or is the market already pricing in future growth?
Preferred Price-to-Sales of 0.1x: Is it justified?
On a P/S of 0.1x, FuboTV trades well below both its estimated fair P/S of 0.6x and peers in the US Interactive Media and Services industry. This suggests the stock is currently priced at a discount relative to its revenue base.
The P/S ratio compares the company’s market value to its revenue and is often used for businesses that are not yet profitable, like FuboTV. With revenue of about $5.3b and a market cap of roughly $1.1b, the current P/S of 0.1x implies investors are paying a relatively low amount for each dollar of sales, especially when set against guidance that earnings are expected to grow very strongly and that the company is forecast to move into profitability over the next 3 years.
Compared with the US Interactive Media and Services industry average P/S of 1x and a peer average of 1.2x, FuboTV’s 0.1x looks sharply compressed. The estimated fair P/S of 0.6x also sits well above the current multiple, pointing to a level the market could move toward if sentiment around revenue quality and future earnings improves.
Result: Price-to-Sales of 0.1x (UNDERVALUED)
However, the narrative could be challenged if ongoing losses of US$84.859m persist, or if long term share price declines continue to weigh on investor confidence.
Another view: DCF signals a much higher value
While the P/S ratio points to a discount, our DCF model goes further, suggesting FuboTV at $10.09 is trading about 85% below an estimated future cash flow value of $69.08. That is a very wide gap. Is this a genuine opportunity, or a sign that expectations are too optimistic?
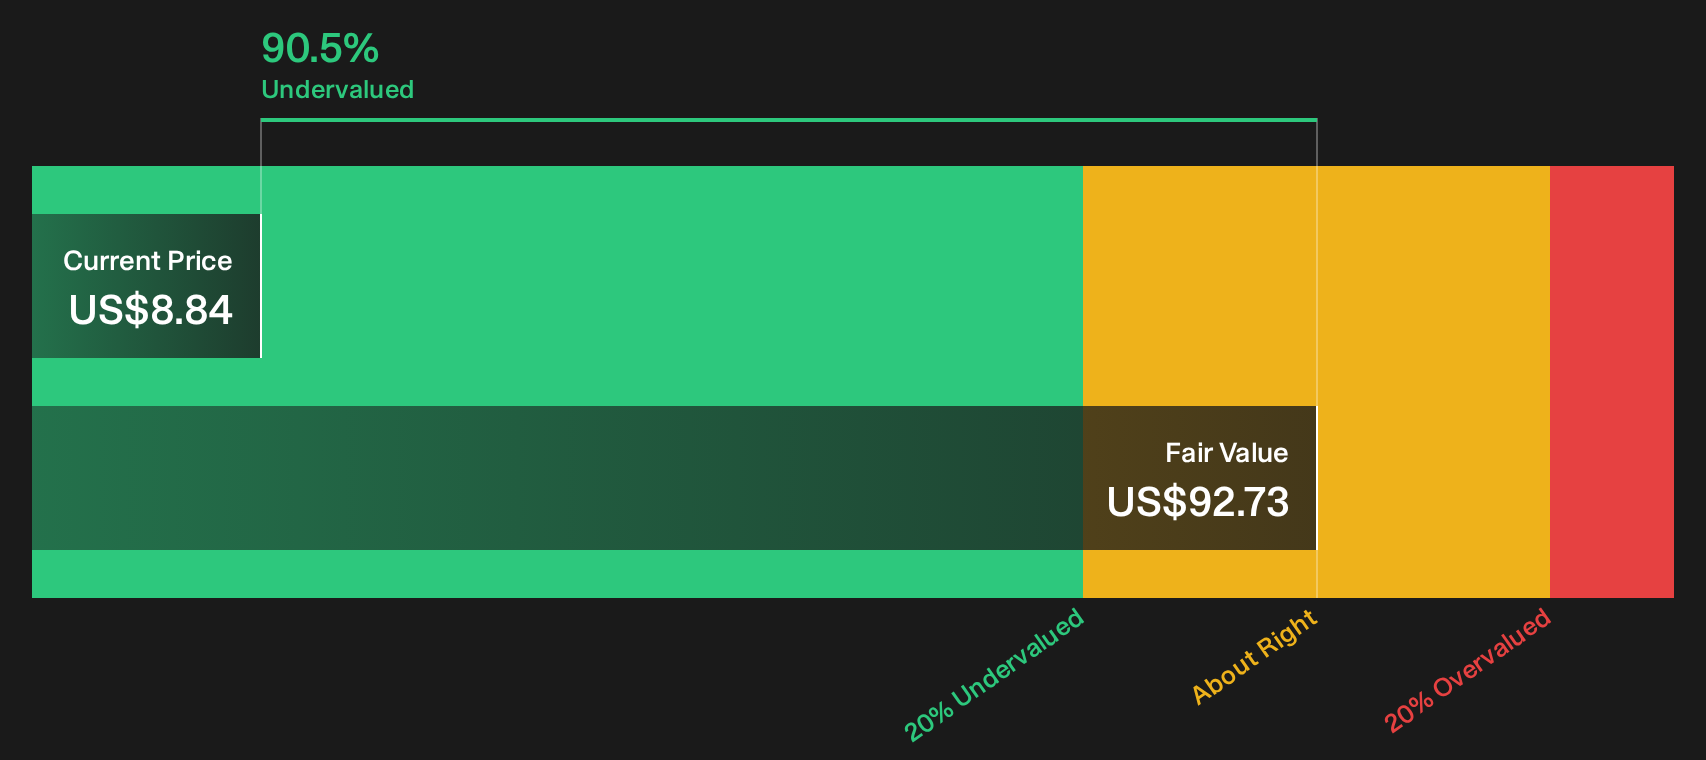
Simply Wall St performs a discounted cash flow (DCF) on every stock in the world every day (check out FuboTV for example). We show the entire calculation in full. You can track the result in your watchlist or portfolio and be alerted when this changes, or use our stock screener to discover 46 high quality undervalued stocks. If you save a screener we even alert you when new companies match - so you never miss a potential opportunity.
Next Steps
If this mix of sharp share price pressure, discounted valuation multiples, and contrasting signals has you undecided, take a closer look at the full picture and weigh the trade off between potential upside and real risks by checking out the 4 key rewards and 2 important warning signs
Looking for more investment ideas?
If FuboTV is on your radar, do not stop here. Widen your search with a few focused stock ideas so you are not missing better fits.
- Target resilience first and check companies that combine healthy finances with staying power using the solid balance sheet and fundamentals stocks screener (46 results)
- Seek potential value candidates by scanning the 46 high quality undervalued stocks that may line up more closely with your expectations on quality and price.
- Spot opportunities others might overlook by reviewing the screener containing 22 high quality undiscovered gems before they attract wider attention.
This article by Simply Wall St is general in nature. We provide commentary based on historical data and analyst forecasts only using an unbiased methodology and our articles are not intended to be financial advice. It does not constitute a recommendation to buy or sell any stock, and does not take account of your objectives, or your financial situation. We aim to bring you long-term focused analysis driven by fundamental data. Note that our analysis may not factor in the latest price-sensitive company announcements or qualitative material. Simply Wall St has no position in any stocks mentioned.