Assessing HA Sustainable Infrastructure Capital (HASI) Valuation After Earnings Beat And Record 2025 Transactions
HA Sustainable Infrastructure Capital, Inc. HASI | 37.11 | -0.09% |
HA Sustainable Infrastructure Capital (HASI) has drawn fresh investor attention after reporting fourth quarter and full year 2025 results that topped revenue expectations, supported by record transaction volumes and renewable energy partnerships.
The earnings beat, record US$4.3b in 2025 transactions and the new quarterly dividend of US$0.425 per share appear to have shifted sentiment. A 20.3% 90 day share price return and a 49.9% one year total shareholder return point to building momentum, despite a weaker five year total shareholder return of 18.1%.
If this update on sustainable infrastructure is on your radar, it could be a good moment to see what else is moving and scan 25 power grid technology and infrastructure stocks as another source of ideas.
With the share price up strongly over the past year, a value score of 1, a modest 5.6% gap to the average analyst target and management talking up higher future earnings, the key question is simple: is there still an opportunity here, or is the market already pricing in the growth story?
Preferred P/E of 27.5x: Is it justified?
HA Sustainable Infrastructure Capital currently trades on a P/E of 27.5x, which sits alongside a last close price of $39.70 and an estimated fair value that implies the shares are trading 11.5% below the SWS DCF model output.
The P/E multiple reflects how much investors are paying for each dollar of current earnings, which is often closely watched for financials whose value is tied to earnings power and contracted cash flows. For HASI, this sits against mixed profit signals, with earnings having grown strongly over the past five years but showing an earnings decline of 7.7% over the last year, while forecasts still point to earnings growth of 17.35% per year and revenue growth of 22.6% per year.
Compared to peers, that 27.5x P/E is materially richer than both the US Diversified Financial industry average of 15.8x and the peer group average of 11.6x. It also stands well above the estimated fair P/E of 16.6x that the fair ratio model suggests the market could move toward if sentiment cools. That gap highlights how much optimism is currently embedded in the price and sets a clear reference point for investors weighing the recent share price run against the underlying earnings profile.
Result: Price-to-Earnings of 27.5x (OVERVALUED)
However, you still need to weigh the rich 27.5x P/E against the recent 5 year total return of 18.1%, as well as the weaker latest earnings trend.
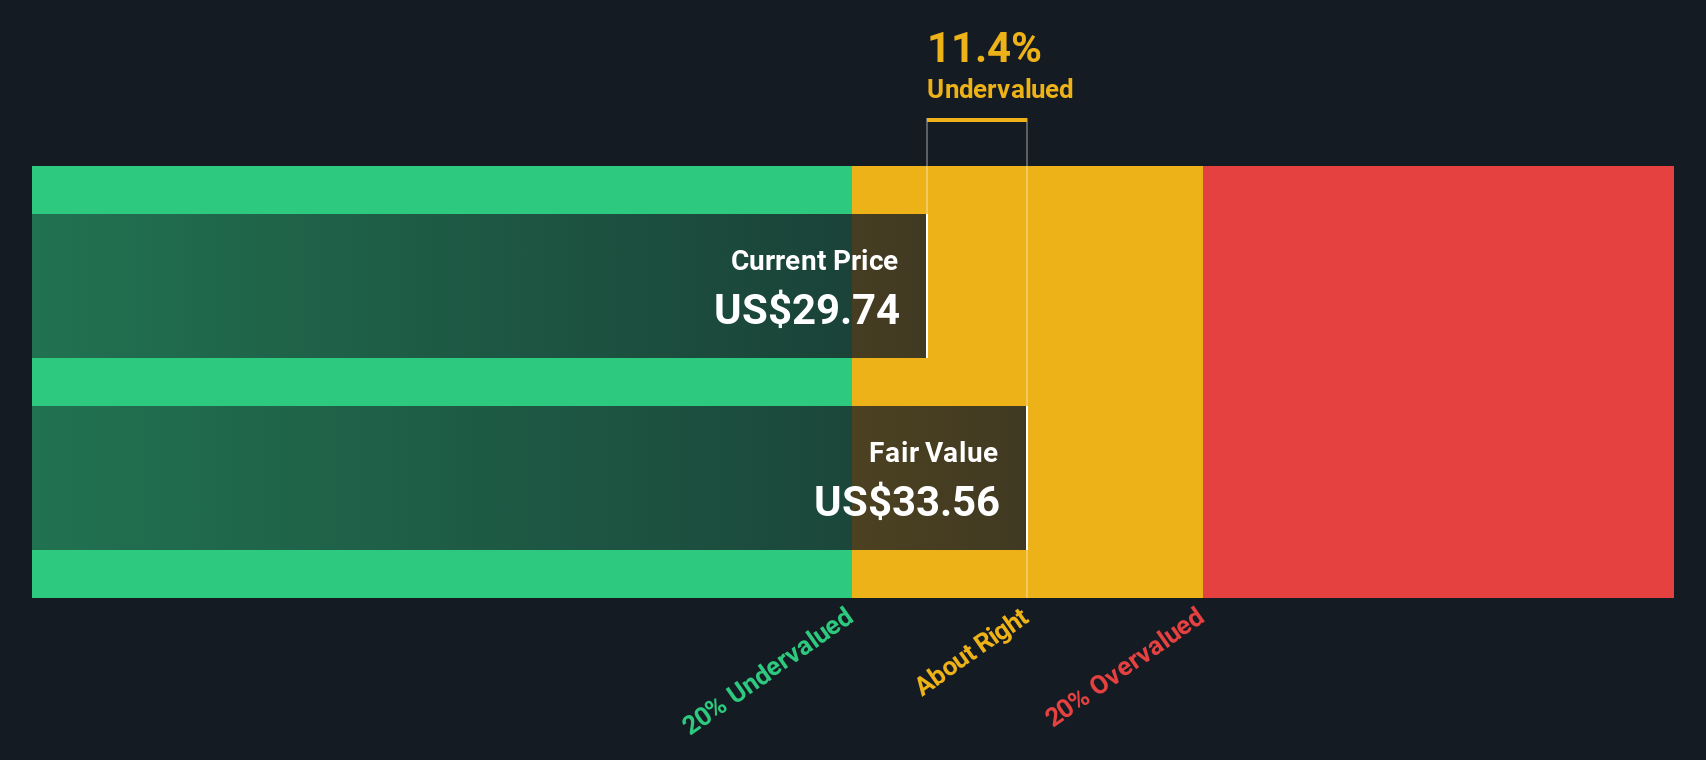
Another View: DCF Points the Other Way
While the 27.5x P/E suggests a rich price tag, our DCF model presents a different perspective. It shows an estimated future cash flow value of $44.88 compared with the current $39.70 share price. That 11.5% gap implies the market could be underestimating future cash flows. Which signal would you trust more?
Simply Wall St performs a discounted cash flow (DCF) on every stock in the world every day (check out HA Sustainable Infrastructure Capital for example). We show the entire calculation in full. You can track the result in your watchlist or portfolio and be alerted when this changes, or use our stock screener to discover 53 high quality undervalued stocks. If you save a screener we even alert you when new companies match - so you never miss a potential opportunity.
Build Your Own HA Sustainable Infrastructure Capital Narrative
If you see the data differently or prefer to piece things together yourself, you can shape your own view in a few minutes and Do it your way.
A great starting point for your HA Sustainable Infrastructure Capital research is our analysis highlighting 2 key rewards and 2 important warning signs that could impact your investment decision.
Ready to find your next idea?
If you are serious about building a stronger portfolio, do not stop with a single stock. Use the screeners below to pressure test your ideas and uncover fresh opportunities.
- Target quality at a discount by scanning our list of 53 high quality undervalued stocks that pair stronger fundamentals with prices that may not fully reflect them yet.
- Review 12 dividend fortresses to focus on companies offering higher yields that might help support long term returns.
- Manage risk by shortlisting companies from the 84 resilient stocks with low risk scores that score better on financial strength and volatility risk.
This article by Simply Wall St is general in nature. We provide commentary based on historical data and analyst forecasts only using an unbiased methodology and our articles are not intended to be financial advice. It does not constitute a recommendation to buy or sell any stock, and does not take account of your objectives, or your financial situation. We aim to bring you long-term focused analysis driven by fundamental data. Note that our analysis may not factor in the latest price-sensitive company announcements or qualitative material. Simply Wall St has no position in any stocks mentioned.