Assessing ITT (ITT) Valuation After Q4 Beat Dividend Hike And SPX FLOW Acquisition Progress
ITT, Inc. ITT | 193.20 | +0.12% |
ITT (ITT) is back in focus after reporting Q4 2025 results that topped expectations, issuing upbeat guidance for early 2026, raising its quarterly dividend by 10%, and advancing the pending SPX FLOW acquisition.
ITT shares have been volatile around the results, with a 1-day share price return of a 2.9% decline, a 7-day gain of 8.06%, and a year-to-date share price return of 15.31%. Over the longer term, total shareholder returns of 37.47% over 1 year and 168.06% over 5 years suggest momentum has been building rather than fading.
If ITT’s recent earnings and acquisition activity have you thinking about what else is moving in industrials, it might be a good time to broaden your search and check out 22 top founder-led companies.
With ITT trading at US$200.88 and screening at a modest intrinsic discount plus a gap to the average analyst price target, the key question is whether that upside reflects mispricing or if the market is already factoring in future growth.
Most Popular Narrative: 10.2% Undervalued
ITT's most followed valuation narrative puts fair value at about $223.67 per share, above the last close of $200.88. This raises some clear questions about what is baked into that gap.
Recent and future bolt-on acquisitions (e.g., Svanehøj, kSARIA, Habonim) are exceeding targets and integrating quickly, forecasted to deliver significant incremental revenue and annual margin improvement, accelerating both top line and EPS growth.
Operational improvements such as automation, productivity initiatives, and strategic pricing combined with visibility from a $2b backlog and resilient end markets, are expected to drive further gains in operating margins, free cash flow conversion, and EPS over the medium and long term.
Want to see what is really behind that higher fair value for ITT? The narrative leans heavily on compounding earnings power, firmer margins, and a richer future profit multiple. Curious how those moving parts fit together and what has to go right for this story to hold? The full narrative lays out the exact earnings, revenue, and valuation assumptions powering that $223.67 figure.
Result: Fair Value of $223.67 (UNDERVALUED)
However, this upside story can quickly look different if project based revenue proves lumpy or if acquisitions underperform, squeezing margins and cash generation.
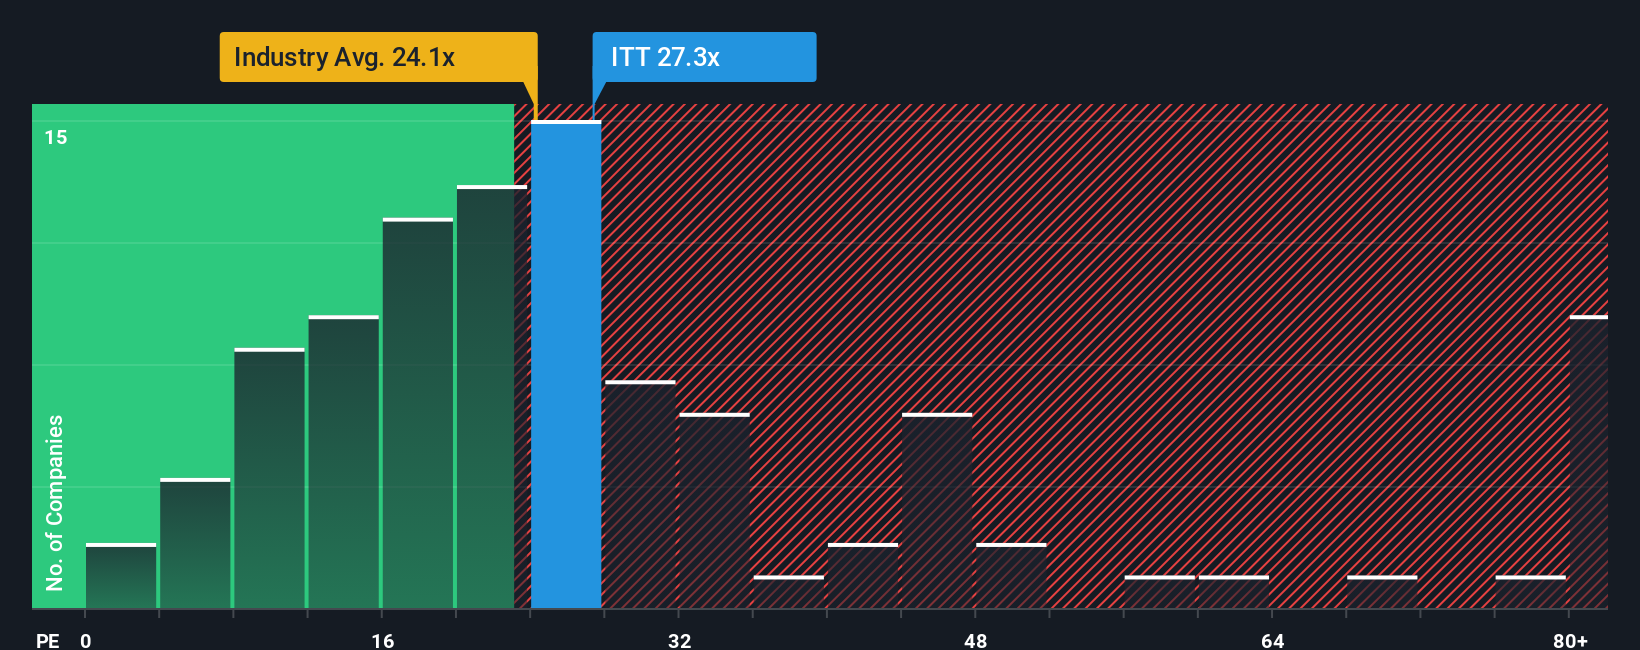
Another Angle On Valuation: P/E Tells A Different Story
The fair value narrative says ITT is 4.8% below our estimate of its worth, but the current P/E of 35.4x sits above both the US Machinery industry at 29.2x and the fair ratio of 28.8x, and just below peers at 40.5x. That mix of premium and discount raises a simple question: are you paying up for quality or leaning into valuation risk?
Build Your Own ITT Narrative
If you see the numbers differently, or prefer to test your own assumptions against the data, you can build a custom thesis for ITT in just a few minutes, starting with Do it your way.
A good starting point is our analysis highlighting 2 key rewards investors are optimistic about regarding ITT.
Looking for more investment ideas?
If ITT looks interesting, do not stop there. The wider market can offer other angles that fit your goals and risk comfort just as well.
- Target potential mispricing by checking our list of 52 high quality undervalued stocks that currently combine quality fundamentals with a price that may not fully reflect them.
- Focus on stability and capital strength by scanning companies in our solid balance sheet and fundamentals stocks screener (45 results) that prioritize resilient finances and disciplined balance sheets.
- Hunt for underfollowed potential by reviewing our screener containing 24 high quality undiscovered gems that have strong fundamentals but less attention from the crowd.
This article by Simply Wall St is general in nature. We provide commentary based on historical data and analyst forecasts only using an unbiased methodology and our articles are not intended to be financial advice. It does not constitute a recommendation to buy or sell any stock, and does not take account of your objectives, or your financial situation. We aim to bring you long-term focused analysis driven by fundamental data. Note that our analysis may not factor in the latest price-sensitive company announcements or qualitative material. Simply Wall St has no position in any stocks mentioned.