

Assessing Janus Living (JAN) Valuation As Senior Housing REIT Draws Fresh Investor Attention
Janus Living, Inc. Class A JAN | 0.00 |
Why Janus Living Is Drawing Investor Attention
Janus Living (JAN) is back on investor radars after fresh performance data highlighted its focus on senior housing, with recent share moves and fundamentals prompting closer scrutiny of this specialized REIT.
At a share price of $27.54, JAN has seen a 1-month share price return of 9.03% and a year to date share price return of 16.69%, suggesting building momentum after a series of smaller recent moves.
If you are comparing Janus Living with other opportunities tied to structural themes, this could be a good moment to scan 21 top founder-led companies
With Janus Living reporting annual revenue growth of 18.80% and net income growth of 58.04% but still posting a net loss, along with an indicated intrinsic discount of 49.29%, is there genuine value here or is the market already pricing in future growth?
Preferred Price-to-Sales of 7.9x: Is It Justified?
On a P/S of 7.9x, Janus Living trades below its closest peer set average of 8.5x, yet above the wider North American Health Care REITs industry average of 5.9x. This puts its current $27.54 share price in the middle of a mixed valuation picture.
P/S compares the company’s market value with its revenue and is often used for REITs and other businesses where earnings are still volatile or currently in loss. For Janus Living, it gives you a way to think about what investors are paying for each dollar of the $655.4m in revenue while the company is still reporting a net loss of $97m.
Within its closer peer group, a 7.9x P/S is framed as good value in the data, suggesting the market is not assigning a premium to Janus Living despite its focused senior housing exposure. Compared with the broader North American Health Care REITs industry, however, the same 7.9x level screens as expensive versus the 5.9x industry average, which implies investors are paying a higher revenue multiple than they would for the sector in general.
With no P/S fair ratio available, there is no regression based reference point indicating where the multiple could trend over time. Investors are left balancing a discount to closer peers against a premium to the wider industry when judging the current pricing level.
Result: Price-to-sales of 7.9x (ABOUT RIGHT)
However, there are clear pressure points, including the current net loss of $97m and heavy senior housing exposure concentrated in Florida and Texas retirement markets.
Another View: What The DCF Model Suggests
The earlier P/S comparison presents Janus Living as roughly fairly placed between peers and the broader Health Care REITs group. Our DCF model indicates an estimated future cash flow value of $54.30 per share, compared with the current $27.54 price, which appears undervalued on this basis. Which signal do you weigh more heavily?
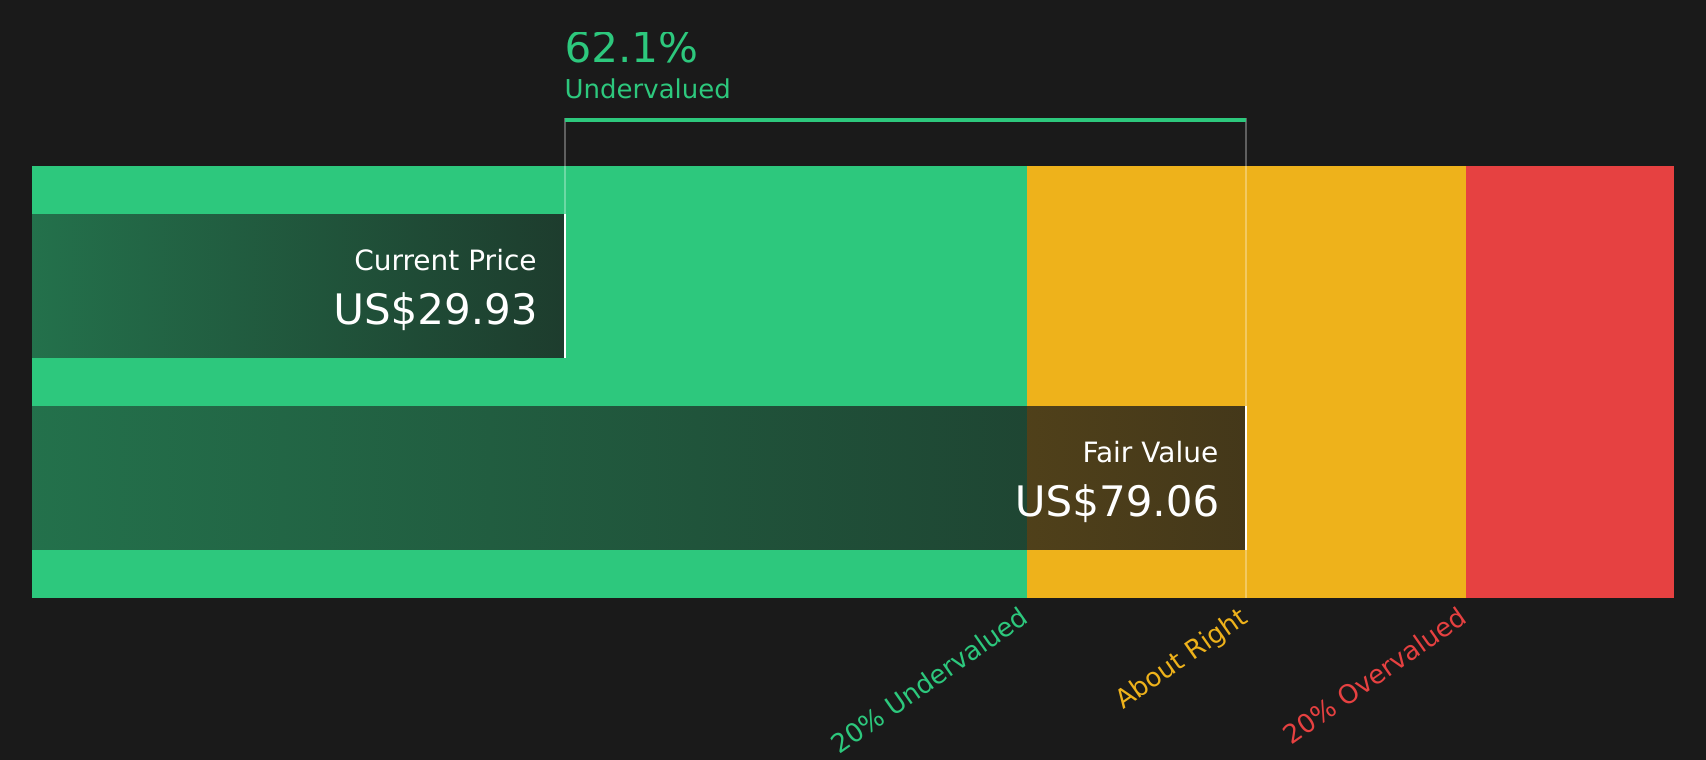
Simply Wall St performs a discounted cash flow (DCF) on every stock in the world every day (check out Janus Living for example). We show the entire calculation in full. You can track the result in your watchlist or portfolio and be alerted when this changes, or use our stock screener to discover 46 high quality undervalued stocks. If you save a screener we even alert you when new companies match - so you never miss a potential opportunity.
Next Steps
The mix of potential upside and clear risks around Janus Living will land differently for each investor, so move quickly to check the full breakdown of 3 key rewards and 1 important warning sign
Looking for more investment ideas?
If Janus Living has caught your eye, do not stop here. Broaden your watchlist with a few focused ideas that could support your overall portfolio decisions.
- Scan 46 high quality undervalued stocks to explore companies that appear to pair solid fundamentals with pricing that may not fully reflect their underlying business characteristics.
- Review 10 dividend fortresses to find securities offering higher yields that might complement growth oriented holdings.
- Consider 64 resilient stocks with low risk scores that aim to keep volatility in check while you stay invested.
This article by Simply Wall St is general in nature. We provide commentary based on historical data and analyst forecasts only using an unbiased methodology and our articles are not intended to be financial advice. It does not constitute a recommendation to buy or sell any stock, and does not take account of your objectives, or your financial situation. We aim to bring you long-term focused analysis driven by fundamental data. Note that our analysis may not factor in the latest price-sensitive company announcements or qualitative material. Simply Wall St has no position in any stocks mentioned.