Assessing Kodiak Sciences (KOD) Valuation After New KSI-101 Retinal Trial Updates
Kodiak Sciences Inc. KOD | 0.00 |
Kodiak Sciences (KOD) is back in focus after sharing new KSI-101 clinical data in Asian MESI patients at the AUS and ARVO meetings, reinforcing interest in its expanding retinal disease pipeline.
The clinical updates around KSI-101 arrive after a sharp re-rating in Kodiak Sciences, with the share price at US$43.96 and a 90-day share price return of 82.33%, contributing to a very large 1-year total shareholder return, while the 5-year total shareholder return remains negative.
If this kind of biotech pipeline news has your attention, it can be useful to widen your field of view using a focused screener for other healthcare names working with AI in medicine such as 33 healthcare AI stocks
After an 82.33% 90-day share price gain, and with Kodiak still reporting losses and no revenue, you have to ask yourself: is this pipeline story still undervalued, or is the market already pricing in a lot of future growth?
Preferred Price to Book of 17.3x: Is It Justified?
Kodiak Sciences is trading at a P/B of 17.3x, which, alongside a recent share price of $43.96, sits well above both industry and peer benchmarks.
P/B compares a company’s market value to its net assets on the balance sheet. A higher ratio means investors are paying more for each dollar of book value. For a clinical stage biotech with no revenue and ongoing losses, this often reflects expectations around the future value of the pipeline rather than current fundamentals.
Here, the gap is wide. The US Biotechs industry average P/B sits at 2.3x, while Kodiak’s peer group average is 3.8x. That places Kodiak at a multiple more than 7x the industry and more than 4x peers. This suggests the market is assigning a sizeable premium to its retinal disease programs and potential future cash flows relative to current assets.
Result: Price-to-book of 17.3x (OVERVALUED)
However, the story can change quickly if key retinal trials disappoint or if continuing losses of around US$229.967 million strain Kodiak’s roughly US$2.7b market value.
Another Way to Look at Value: SWS DCF Model
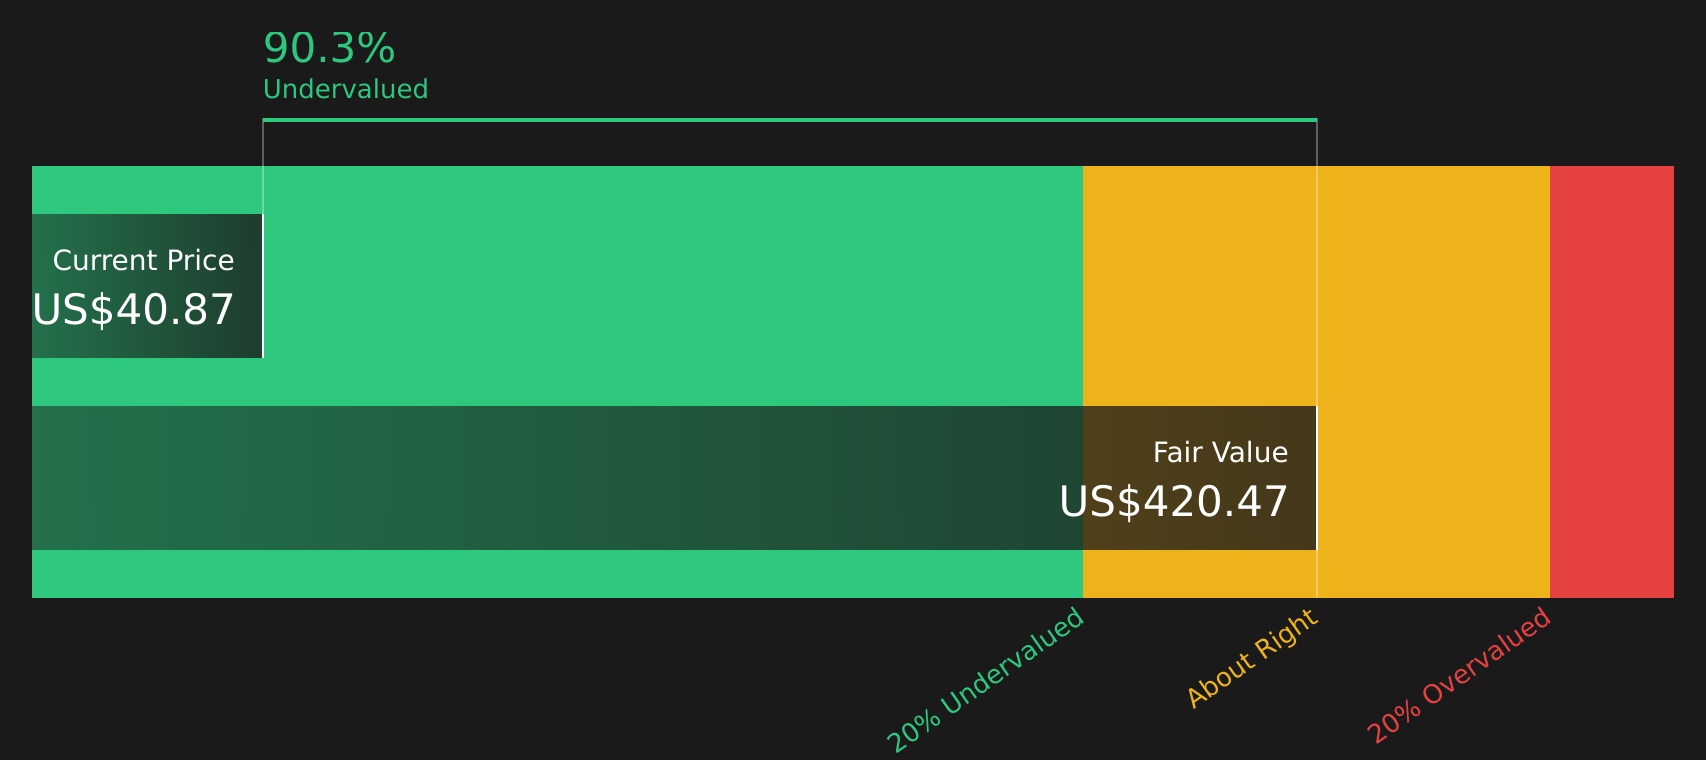
The high 17.3x P/B paints Kodiak as expensive, but the SWS DCF model tells a very different story. With the share price at $43.96 versus an estimated future cash flow value of $328.09, the model suggests the stock is trading at an 86.6% discount. So which signal should matter more to you?
Simply Wall St performs a discounted cash flow (DCF) on every stock in the world every day (check out Kodiak Sciences for example). We show the entire calculation in full. You can track the result in your watchlist or portfolio and be alerted when this changes, or use our stock screener to discover 50 high quality undervalued stocks. If you save a screener we even alert you when new companies match - so you never miss a potential opportunity.
Next Steps
Curious whether this optimism matches your own view or feels stretched at these levels? Take a moment to weigh both sides of the story with 1 key reward and 5 important warning signs
Looking for more investment ideas?
If Kodiak has sharpened your interest, do not stop here. Broaden your watchlist with other clear, data backed opportunities that could complement or balance your portfolio.
- Target higher quality at sensible prices by scanning 50 high quality undervalued stocks that combine strong fundamentals with attractive valuations.
- Strengthen your focus on resilience by checking 69 resilient stocks with low risk scores that score well on stability and downside protection.
- Spot future standouts early by tracking the screener containing 25 high quality undiscovered gems before they sit firmly on every investor’s radar.
This article by Simply Wall St is general in nature. We provide commentary based on historical data and analyst forecasts only using an unbiased methodology and our articles are not intended to be financial advice. It does not constitute a recommendation to buy or sell any stock, and does not take account of your objectives, or your financial situation. We aim to bring you long-term focused analysis driven by fundamental data. Note that our analysis may not factor in the latest price-sensitive company announcements or qualitative material. Simply Wall St has no position in any stocks mentioned.