Assessing Ladder Capital (LADR) Valuation After Sustained Stock Slide And Softer Financial Results
Ladder Capital Corp. Class A LADR | 0.00 |
Stock slide puts Ladder Capital under closer scrutiny
The recent slide in Ladder Capital (LADR) to around $10.22, alongside softer quarterly results, has put the real estate lender’s fundamentals under closer scrutiny for investors assessing income and value opportunities.
While the 1-day and 7-day share price returns have been slightly positive, the year-to-date share price return is down 7.93%. However, the 1-year and 3-year total shareholder returns of 7.32% and 32.04% show that income and reinvested dividends have been an important part of the overall outcome.
If this kind of income story has your attention, it can be worth broadening your search and checking out our screener of 20 top founder-led companies
With Ladder Capital trading at about $10.22 and sitting roughly 20% below the average analyst price target, yet facing weaker earnings and tangible book value trends, is this a genuine value opportunity or a stock correctly pricing in slower growth?
Price-to-earnings of 23.7x: Is it justified?
Ladder Capital currently trades on a P/E of 23.7x, which sits well above several comparison points and raises questions about how much optimism is already in the price at $10.22.
The P/E ratio compares the share price with earnings per share and is a quick way to see how much investors are paying for each dollar of current earnings. For a mortgage REIT that distributes a large share of its income, this metric often reflects what the market expects from future earnings and dividend stability.
In Ladder Capital’s case, the current P/E of 23.7x is described as expensive relative to a fair P/E estimate of 15.1x, as well as above the US Mortgage REITs industry average of 11.7x and a peer average of 16.6x. That is a clear premium, and it suggests the market is assigning a higher price to each dollar of earnings than it does for both the sector and similar companies, even with recent pressure on margins and a low 3.8% return on equity.
Given those gaps, the fair ratio level implied by the analysis is a point some investors may watch closely as sentiment around earnings quality, growth forecasts and dividend coverage evolves over time. Explore the SWS fair ratio for Ladder Capital
Result: Price-to-earnings of 23.7x (OVERVALUED)
However, higher valuation multiples, combined with weaker recent earnings trends and a low 3.8% return on equity, could challenge the idea that this discount reflects mispricing.
Another view: cash flows tell a tougher story
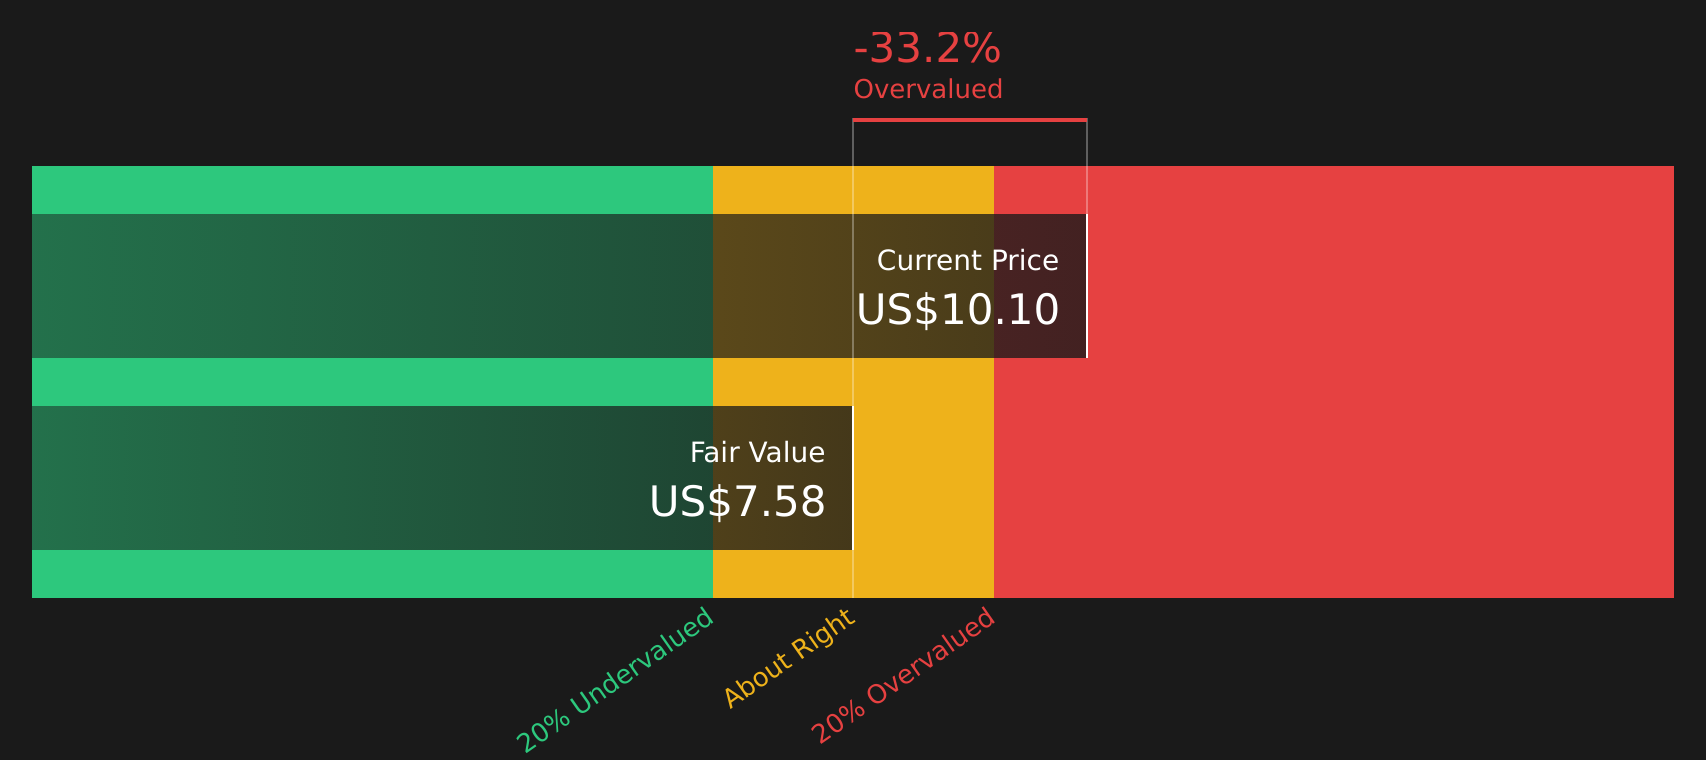
While the P/E ratio suggests Ladder Capital is expensive, the SWS DCF model paints an even starker picture. At $10.22, the stock sits above an estimated future cash flow value of $7.58, which frames the current price as overvalued rather than discounted. So which signal carries more weight for you?
Simply Wall St performs a discounted cash flow (DCF) on every stock in the world every day (check out Ladder Capital for example). We show the entire calculation in full. You can track the result in your watchlist or portfolio and be alerted when this changes, or use our stock screener to discover 46 high quality undervalued stocks. If you save a screener we even alert you when new companies match - so you never miss a potential opportunity.
Next Steps
With mixed signals on valuation, income and growth, it makes sense to weigh the evidence quickly and test the numbers yourself against 2 key rewards and 3 important warning signs
Ready to hunt for your next opportunity?
If you stop at one stock, you miss the bigger picture. Put the same scrutiny to work across other ideas and give yourself more options.
- Target companies with dependable income profiles using our 10 dividend fortresses, which is designed for investors who want yields backed by real fundamentals.
- Spot potential mispricings early by scanning the market with the 46 high quality undervalued stocks, a tool tailored to highlight companies whose financials may not match current pricing.
- Focus on resilience first and stress less about surprises by reviewing the 64 resilient stocks with low risk scores, so you do not overlook steadier opportunities.
This article by Simply Wall St is general in nature. We provide commentary based on historical data and analyst forecasts only using an unbiased methodology and our articles are not intended to be financial advice. It does not constitute a recommendation to buy or sell any stock, and does not take account of your objectives, or your financial situation. We aim to bring you long-term focused analysis driven by fundamental data. Note that our analysis may not factor in the latest price-sensitive company announcements or qualitative material. Simply Wall St has no position in any stocks mentioned.