Assessing LKQ (LKQ) Valuation After Prolonged Share Price Weakness
LKQ Corporation LKQ | 0.00 |
Recent share performance and business snapshot
LKQ (LKQ) has been under pressure recently, with the stock down 3.9% over the past week, 8.6% over the past month, and 19.1% over the past 3 months.
Over longer periods, the stock has declined 13.2% year to date and 32.3% over the past year. The 3 year and 5 year total returns are also negative. This weak share performance contrasts with LKQ’s ongoing role as a large distributor of vehicle replacement parts and accessories across North America and Europe.
The company reports annual revenue of US$13.8b and net income of US$515.0m, with both revenue and earnings showing year on year growth based on the latest figures provided. LKQ operates through four segments, with revenue contributions from North America, Europe, Specialty, and an eliminations line that reflects internal adjustments.
The recent 1 day share price return of down 3.9% continues a weaker run that has left LKQ with a year to date share price decline and a 1 year total shareholder return down 32.3%. This indicates fading momentum despite ongoing revenue and net income growth.
If you are reassessing LKQ and want to see what else is moving, this could be a good moment to scan 33 power grid technology and infrastructure stocks
With LKQ now trading at a steep discount to analyst targets and its latest figures showing both revenue and net income growth, you have to ask whether the stock is mispriced or if markets are already factoring in its future potential.
Preferred Price to Earnings of 12.9x: Is it justified?
LKQ is trading on a P/E of 12.9x, which sits below both its peer group and the broader Global Retail Distributors industry, despite the recent share price weakness.
The P/E ratio compares the current share price of $26.07 to the company’s earnings per share. It gives a quick sense of how much investors are paying for each dollar of profit. For a business with US$13.8b in revenue, US$515.0m in net income and a large presence across North America and Europe, this multiple frames how the market is currently pricing those earnings.
On Simply Wall St’s numbers, LKQ screens as good value against several benchmarks. The current 12.9x P/E is below the peer average of 13.2x and below the Global Retail Distributors industry average of 15.5x. It is also below an estimated fair P/E of 18x, a level the market could move towards if sentiment and earnings expectations were to align with that fair ratio view.
Result: Price-to-Earnings of 12.9x (UNDERVALUED)
However, you still need to weigh risks such as ongoing share price weakness, with the stock down 46.4% over 3 years, and slowing annual revenue growth of 1.9%.
Another way to look at value
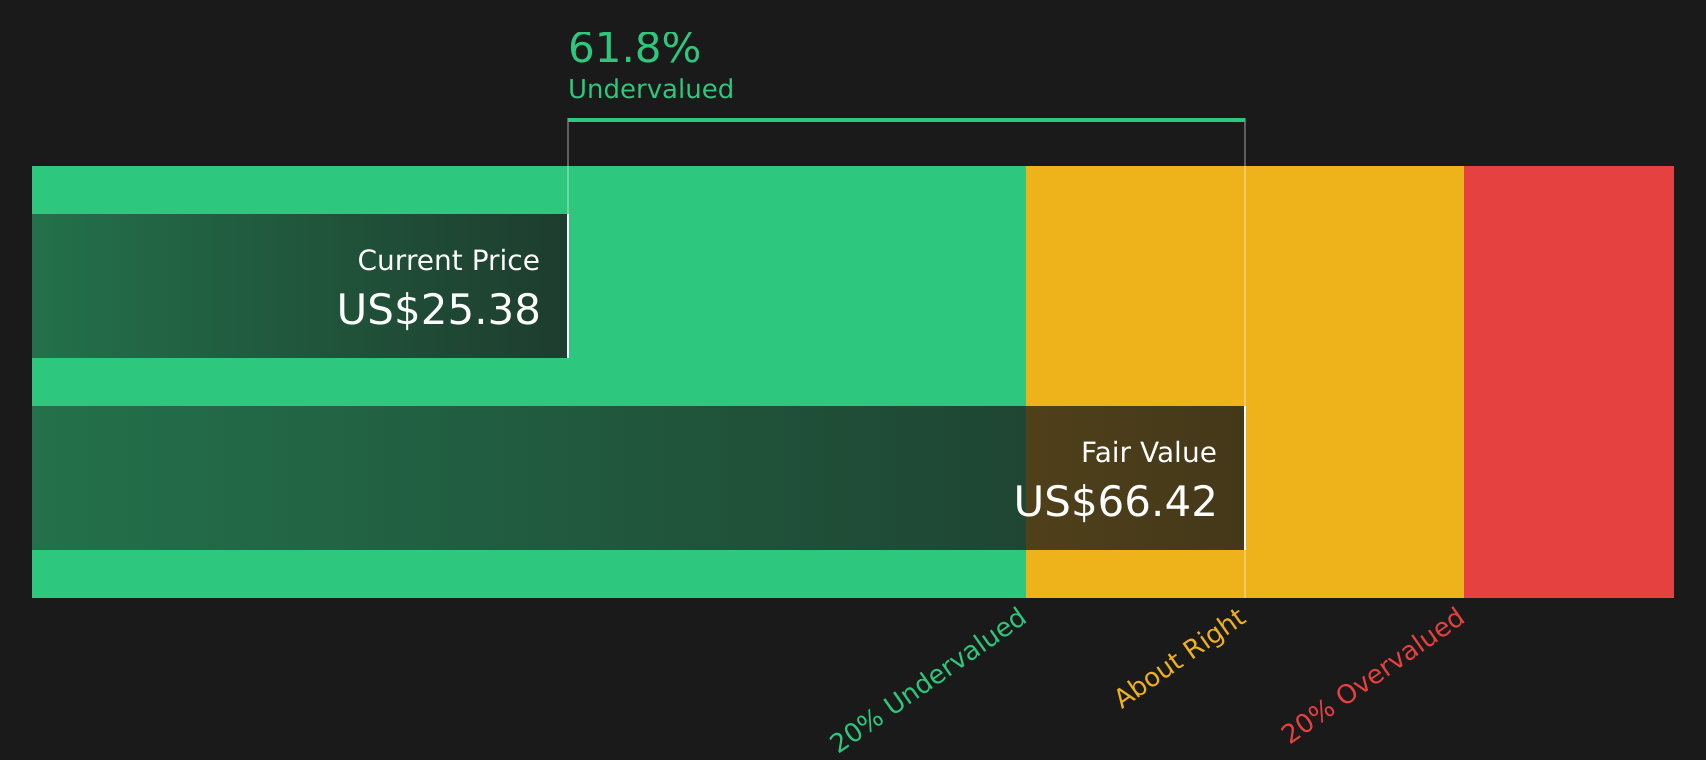
The P/E comparison suggests LKQ looks cheap, but our DCF model goes further. It values future cash flows at about $58.38 per share, while the stock trades at $26.07. That points to a steep discount. Is the gap a margin of safety or a sign the market sees something missing?
Simply Wall St performs a discounted cash flow (DCF) on every stock in the world every day (check out LKQ for example). We show the entire calculation in full. You can track the result in your watchlist or portfolio and be alerted when this changes, or use our stock screener to discover 47 high quality undervalued stocks. If you save a screener we even alert you when new companies match - so you never miss a potential opportunity.
Next Steps
With sentiment clearly mixed, this is a good time to look through the full set of facts yourself rather than rely on headlines. To weigh the trade off between the risks investors are wary of and the rewards others are optimistic about, start with the 4 key rewards and 1 important warning sign
Looking for more investment ideas?
If LKQ is raising questions for you, do not stop here. Broaden your watchlist now so you are not relying on a single stock story.
- Target steadier opportunities by checking companies that pass a 62 resilient stocks with low risk scores and might suit a more defense minded portfolio.
- Hunt for potential value setups by reviewing a 47 high quality undervalued stocks that matches solid fundamentals with attractive pricing.
- Spot earlier stage opportunities by scanning the 24 elite penny stocks with strong financials that still show stronger financial footing than most.
This article by Simply Wall St is general in nature. We provide commentary based on historical data and analyst forecasts only using an unbiased methodology and our articles are not intended to be financial advice. It does not constitute a recommendation to buy or sell any stock, and does not take account of your objectives, or your financial situation. We aim to bring you long-term focused analysis driven by fundamental data. Note that our analysis may not factor in the latest price-sensitive company announcements or qualitative material. Simply Wall St has no position in any stocks mentioned.