Assessing Nuvalent (NUVL) Valuation After Recent Share Price Volatility And DCF Upside Signals
Nuvalent, Inc. Class A NUVL | 0.00 |
Nuvalent (NUVL) has drawn investor attention after recent share price moves, with the stock last closing at $101. With no revenue yet, the clinical-stage biopharma story rests on pipeline progress and ongoing trial outcomes.
Recent trading has been choppy, with the 1-day share price return of 1.10% contrasting with a 30-day share price decline of 6.14%. However, the 1-year total shareholder return of 33.10% and 3-year total shareholder return of about 2.5x indicate that longer term momentum remains strong.
If Nuvalent’s clinical story has caught your eye, it can help to compare it with other cancer and drug discovery plays using a screener focused on 29 healthcare AI stocks
With Nuvalent still pre revenue, a recent pullback and a share price well below some analyst targets, the key question is whether the current valuation leaves upside on the table or if the market already prices in future growth.
Preferred Price to Book Ratio of 6.8x: Is it justified?
Nuvalent currently trades at a P/B of 6.8x, which the SWS model flags as good value relative to its peer group average of 13.1x, even though the stock is loss making.
The P/B ratio compares the market value of the company to its net assets on the balance sheet. This can be a common reference point for early stage biopharma stocks that do not yet generate revenue or earnings. For a clinical stage company, this often reflects how investors collectively value the drug pipeline, intellectual property and cash position on top of book equity.
Within the immediate peer set, Nuvalent’s 6.8x sits well below the 13.1x average, which suggests the stock is priced at a lower premium to its balance sheet than similar companies. However, compared with the broader US Biotechs industry average P/B of 2.3x, Nuvalent trades at a higher multiple, indicating the market is assigning a richer valuation than it does to the sector overall.
Result: Price-to-book of 6.8x (ABOUT RIGHT)
However, the story depends heavily on clinical trial outcomes and ongoing losses of US$450.074 million, so any setback or funding pressure could quickly reset sentiment.
Another View: DCF Points To A Very Different Story
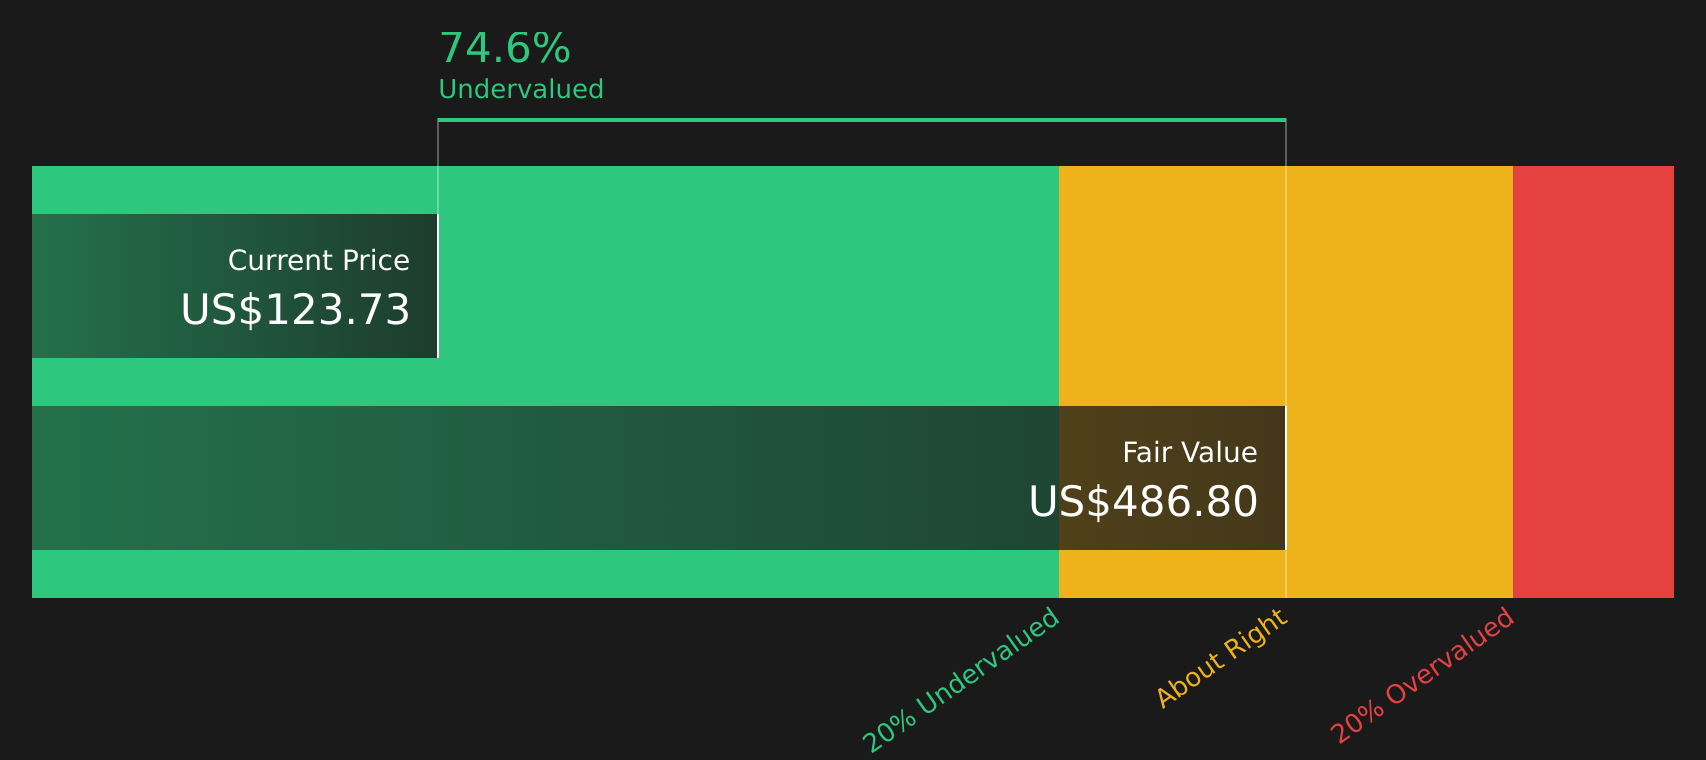
While the 6.8x P/B ratio suggests the stock is roughly in line with its balance sheet strength versus peers, the SWS DCF model comes to a very different conclusion. With an estimated future cash flow value of $612.33 per share versus a current price of $101, it flags Nuvalent as heavily undervalued.
For you as an investor, that gap highlights a clear tension. Are markets right to focus on current losses and clinical risk, or is the DCF capturing potential that price has not yet reflected?
Simply Wall St performs a discounted cash flow (DCF) on every stock in the world every day (check out Nuvalent for example). We show the entire calculation in full. You can track the result in your watchlist or portfolio and be alerted when this changes, or use our stock screener to discover 54 high quality undervalued stocks. If you save a screener we even alert you when new companies match - so you never miss a potential opportunity.
Next Steps
Given the mixed signals around valuation and clinical risk, you do not need to wait to form a view. For a clearer understanding, review the full picture of potential upsides and downsides with 3 key rewards and 2 important warning signs
Looking for more investment ideas?
If Nuvalent is on the watchlist, do not stop there. Broaden the opportunity set with a few focused stock ideas that could sharpen portfolio decisions.
- Target potential mispricings by checking out the 54 high quality undervalued stocks that combine solid fundamentals with attractive valuations.
- Build a steadier income stream by reviewing the 12 dividend fortresses that may help anchor returns with higher yields.
- Prioritise resilience by scanning the 66 resilient stocks with low risk scores that score well on financial strength and business risk.
This article by Simply Wall St is general in nature. We provide commentary based on historical data and analyst forecasts only using an unbiased methodology and our articles are not intended to be financial advice. It does not constitute a recommendation to buy or sell any stock, and does not take account of your objectives, or your financial situation. We aim to bring you long-term focused analysis driven by fundamental data. Note that our analysis may not factor in the latest price-sensitive company announcements or qualitative material. Simply Wall St has no position in any stocks mentioned.