

Assessing Permian Basin Royalty Trust (PBT) Valuation After Strong Recent Share Price Momentum
Permian Basin Royalty Trust PBT | 0.00 |
Recent performance of Permian Basin Royalty Trust (PBT)
Permian Basin Royalty Trust (PBT) has drawn fresh attention after a strong stretch for the stock, with returns of 3.4% over the past day, 6.9% over the past week, and 39.4% over the past month.
Set against a 1 year total shareholder return of 181% and a 5 year total shareholder return of roughly 8x, the recent 30 day share price return of 39.4% and year to date share price return of 76.3% suggest strong momentum building from earlier levels.
If strong momentum in PBT has you looking across the energy patch, this could be a useful moment to scan other opportunities through our 33 elite gold producer stocks
With Permian Basin Royalty Trust showing strong recent returns and an intrinsic value estimate suggesting only a small premium, investors now face a key question: is there still a buying opportunity here, or is the market already pricing in future growth?
Price-to-Earnings of 98.1x: Is it justified?
On a P/E of 98.1x at a last close of $31.01, Permian Basin Royalty Trust trades at a much richer earnings multiple than both its industry and peer group, which points to a market that is placing a high value on each dollar of current profit.
The P/E multiple compares the current share price to earnings per share and is a quick way to see how much investors are paying for today's earnings. For an oil and gas royalty trust, which is closely linked to commodity driven cash flows, a high P/E usually reflects expectations that current earnings levels are either unusually low relative to future potential or that the earnings stream is perceived as very resilient.
Here, the P/E of 98.1x stands far above the US Oil and Gas industry average of 14.6x and the peer average of 20.7x, which is a strong relative premium. With earnings growth over the past year having declined 34.6% and net profit margins easing from 93.3% to 88.6%, this premium suggests the market is assigning a very optimistic view to future earnings for PBT compared with the broader group.
Result: Price-to-Earnings of 98.1x (OVERVALUED)
However, you also need to weigh risks such as a very rich 98.1x P/E multiple and the trust's full reliance on US oil and gas royalty income.
Another View: Cash Flows Point To A Very Different Story
While the 98.1x P/E ratio presents PBT as expensive relative to peers, the SWS DCF model raises that concern further. With an estimated future cash flow value of $9.37 compared with the current $31.01 price, the stock appears clearly overvalued on this approach. So which signal should investors place more weight on, earnings or cash flows?
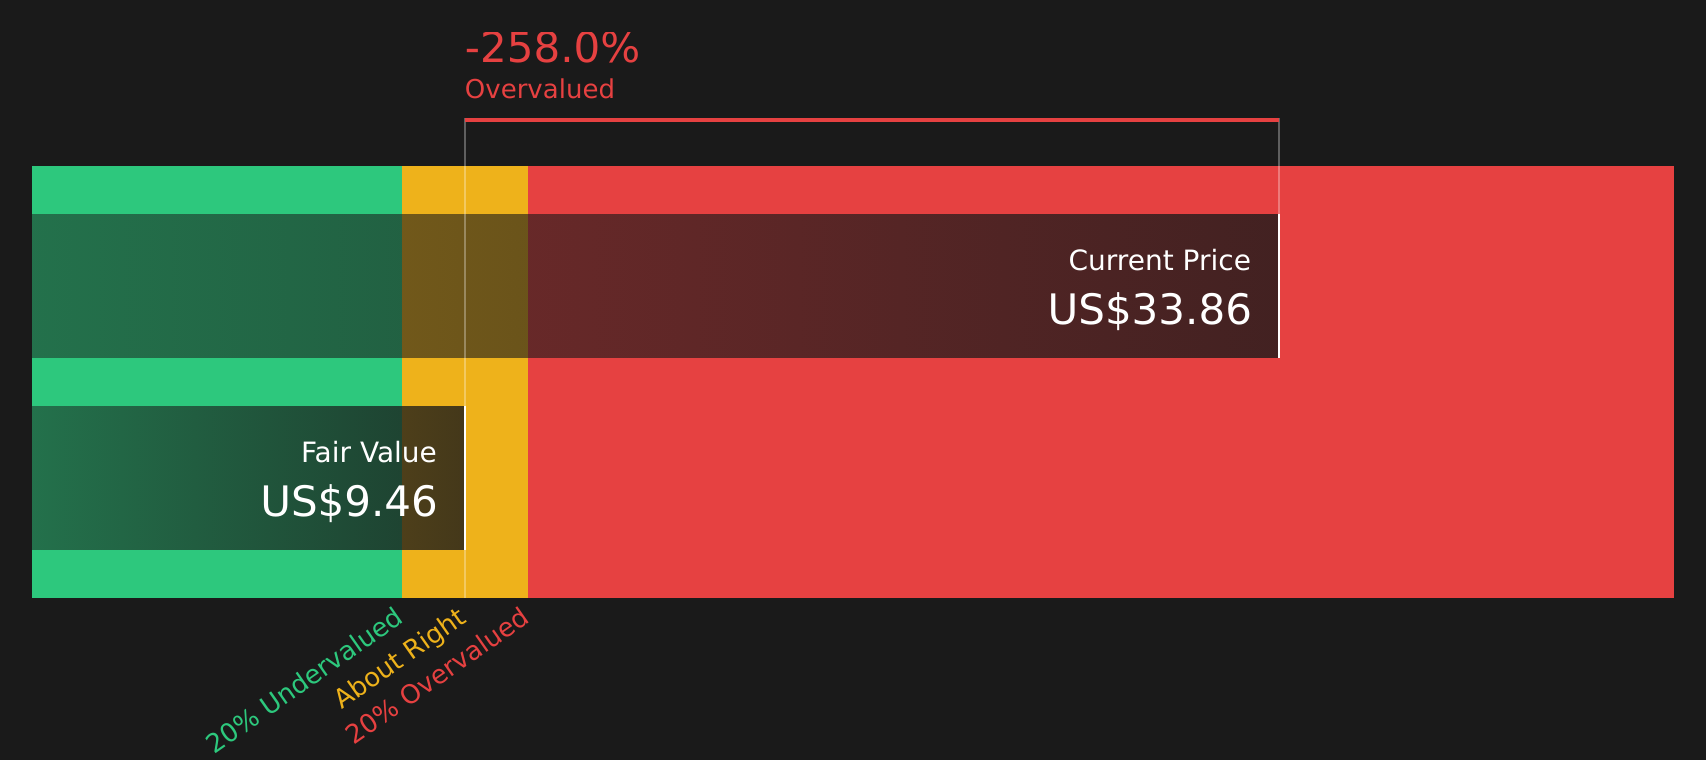
Simply Wall St performs a discounted cash flow (DCF) on every stock in the world every day (check out Permian Basin Royalty Trust for example). We show the entire calculation in full. You can track the result in your watchlist or portfolio and be alerted when this changes, or use our stock screener to discover 49 high quality undervalued stocks. If you save a screener we even alert you when new companies match - so you never miss a potential opportunity.
Next Steps
Looking for more investment ideas?
If PBT has sharpened your interest, this is the moment to widen your search and line up a few more stocks that could deserve your attention.
- Target potential mispricing by scanning 49 high quality undervalued stocks that combine solid fundamentals with prices that may not fully reflect their financial profile.
- Build a steadier income stream by reviewing 10 dividend fortresses that pair 5%+ yields with an emphasis on resilience.
- Strengthen your watchlist with 67 resilient stocks with low risk scores that score well on financial robustness and lower overall risk.
This article by Simply Wall St is general in nature. We provide commentary based on historical data and analyst forecasts only using an unbiased methodology and our articles are not intended to be financial advice. It does not constitute a recommendation to buy or sell any stock, and does not take account of your objectives, or your financial situation. We aim to bring you long-term focused analysis driven by fundamental data. Note that our analysis may not factor in the latest price-sensitive company announcements or qualitative material. Simply Wall St has no position in any stocks mentioned.