Assessing Procter & Gamble (PG) Valuation As Recent Share Weakness Meets Conflicting Fair Value Signals
Procter & Gamble Company PG | 0.00 |
Recent share performance and business snapshot
Procter & Gamble (PG) has been under pressure recently, with the stock down around 4% over the past month and about 11% over the past 3 months, prompting investors to reassess the consumer staples giant.
At a recent close of US$141.57, the company carries a market value of about US$329.7b and generates annual revenue of roughly US$86.7b, with net income of about US$16.3b across its broad portfolio of household brands.
Recent trading suggests momentum is fading, with the stock down over the past month and quarter, while the 1 year total shareholder return of about 11.6% and 5 year total shareholder return of roughly 16.5% highlight a more modest long term outcome.
If Procter & Gamble has you reassessing consumer staples, it can help to widen your watchlist and review 19 top founder-led companies as potential long term compounders alongside established blue chips.
So with Procter & Gamble’s share price under pressure, an indicated intrinsic value gap of about 24% and a discount of roughly 16% to analyst targets, is this weakness a buying opportunity, or is the market already pricing in future growth?
Most Popular Narrative: 16.9% Overvalued
According to the most followed narrative on Simply Wall St, Procter & Gamble's fair value of about $121.06 sits below the recent $141.57 share price, pointing to a valuation premium that investors may want to understand in more detail.
Procter & Gamble, despite being within a very competitive industry, still has some competitive advantages, shown in its higher operating margin above the ~20% mark and the Morning Star Wide Moat. Also, the fact that the ROIC is double the Cost of Capital means its capital allocation is being well managed.
The narrative leans on high returns on capital, a wide moat and steady but moderate growth assumptions, all filtered through a detailed multi model valuation framework that compresses complex inputs into a single fair value anchor.
Result: Fair Value of $121.06 (OVERVALUED)
However, this view can be challenged if consumer spending weakens further or if higher input costs pressure Procter & Gamble's margins and cash flows.
Another Angle On Value
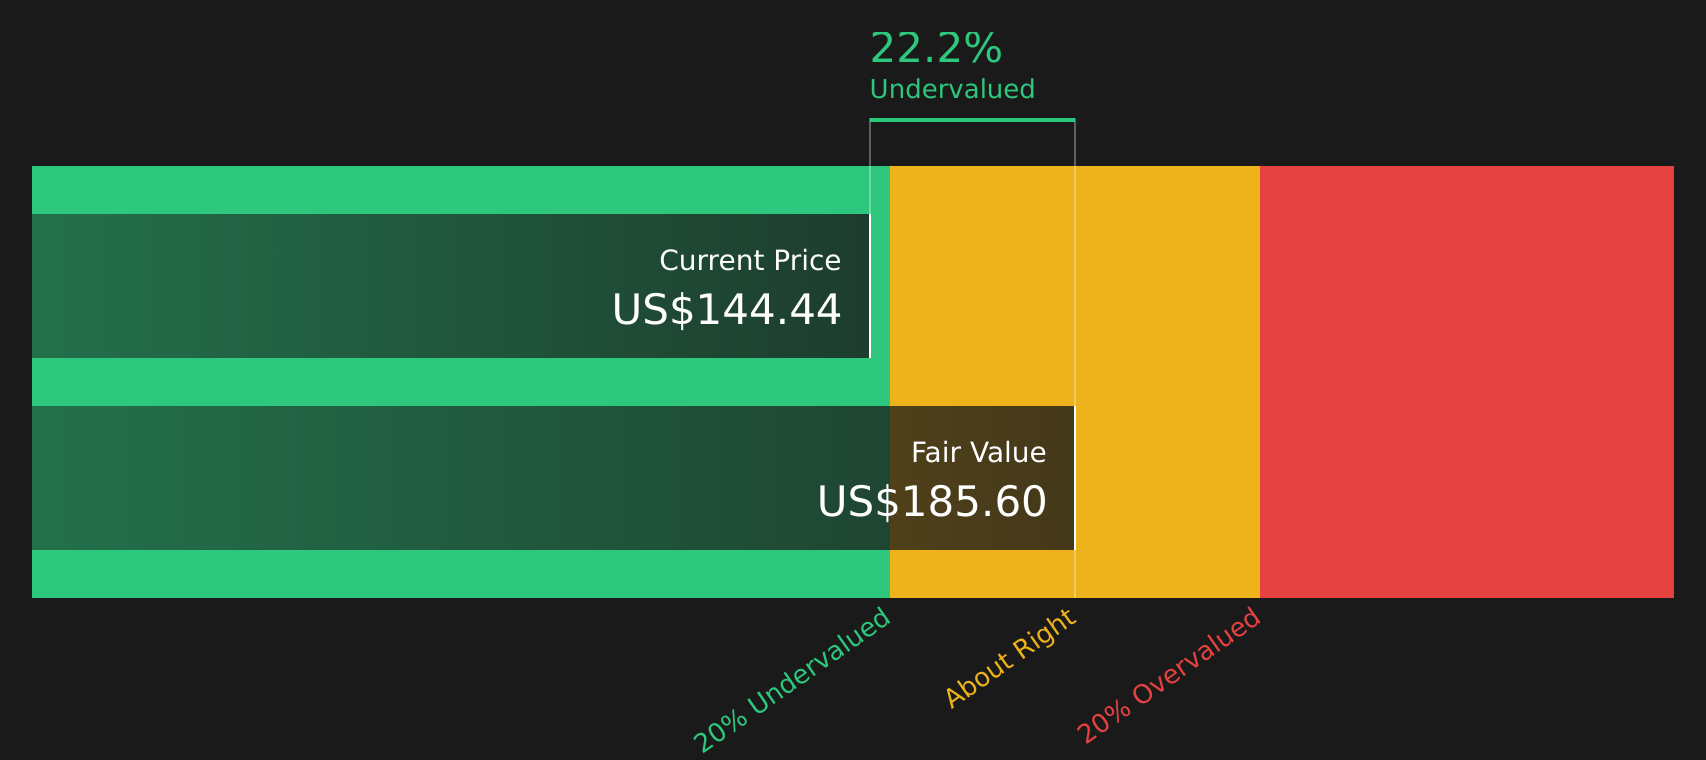
Simply Wall St’s own SWS DCF model paints a very different picture to the user narrative. On this view, Procter & Gamble, at $141.57, sits about 23.7% below an estimated future cash flow value of $185.60, which points to undervaluation rather than a premium. For you as an investor, that split between cash flow based value and a $121.06 narrative fair value raises a simple question: which set of assumptions do you trust more?
Simply Wall St performs a discounted cash flow (DCF) on every stock in the world every day (check out Procter & Gamble for example). We show the entire calculation in full. You can track the result in your watchlist or portfolio and be alerted when this changes, or use our stock screener to discover 51 high quality undervalued stocks. If you save a screener we even alert you when new companies match - so you never miss a potential opportunity.
Next Steps
With Procter & Gamble showing both pressure on the share price and mixed valuation signals, it makes sense to check the full picture yourself and weigh the company’s potential rewards against the concerns highlighted by our 4 key rewards and 2 important warning signs.
Looking for more investment ideas?
If you stop with just one stock, you could miss opportunities that fit your goals even better, so keep your watchlist open and stay curious.
- Target dependable cash generators by scanning for companies on solid footing through the solid balance sheet and fundamentals stocks screener (45 results).
- Hunt for potential value opportunities by checking out the 51 high quality undervalued stocks that may not be fully appreciated by the market yet.
- Capture reliable income prospects by reviewing a curated set of 14 dividend fortresses that aim to support consistent payouts.
This article by Simply Wall St is general in nature. We provide commentary based on historical data and analyst forecasts only using an unbiased methodology and our articles are not intended to be financial advice. It does not constitute a recommendation to buy or sell any stock, and does not take account of your objectives, or your financial situation. We aim to bring you long-term focused analysis driven by fundamental data. Note that our analysis may not factor in the latest price-sensitive company announcements or qualitative material. Simply Wall St has no position in any stocks mentioned.