Assessing Sanmina’s (SANM) Valuation After Mixed Recent Share Performance
Sanmina Corporation SANM | 130.21 | +0.02% |
What recent performance says about Sanmina stock
Sanmina (SANM) has recently shown mixed share price performance, with a 3.2% gain over the past day but declines over the past week, month, and past 3 months that may catch investors’ attention.
That 3.2% 1 day share price return comes after a weaker patch, with the 30 day share price return of 17.83% and year to date share price return of 8.46% both pointing to fading short term momentum. At the same time, the 1 year total shareholder return of 62.63% highlights how strong the longer term picture has been.
If Sanmina’s recent swings have you thinking about where else growth and resilience might show up next, it could be worth checking our screener of 25 power grid technology and infrastructure stocks as another way to spot potential opportunities.
With Sanmina trading at US$145.81 against an analyst price target of US$197.50, the big question is whether the current valuation still leaves room for upside or if the market is already pricing in future growth.
Most Popular Narrative: 26.2% Undervalued
Sanmina’s most followed valuation narrative pegs fair value at $197.50, well above the last close at $145.81, which is what underpins the current bullish skew around the stock.
The imminent acquisition of ZT Systems is expected to add $5-6 billion of annual run-rate revenue, positioning Sanmina to double its net revenue within three years and capitalize on explosive growth in data center and AI infrastructure investment; this should provide a multi-year boost to overall revenue and EPS accretion from synergies and integration.
Curious what sits behind that higher fair value, and why the model leans on stronger revenue, fatter margins and a richer future earnings multiple, without spelling out every number here.
Result: Fair Value of $197.50 (UNDERVALUED)
However, that upbeat story could be tested if the ZT Systems acquisition proves harder to integrate than expected, or if any major customer sharply reduces orders.
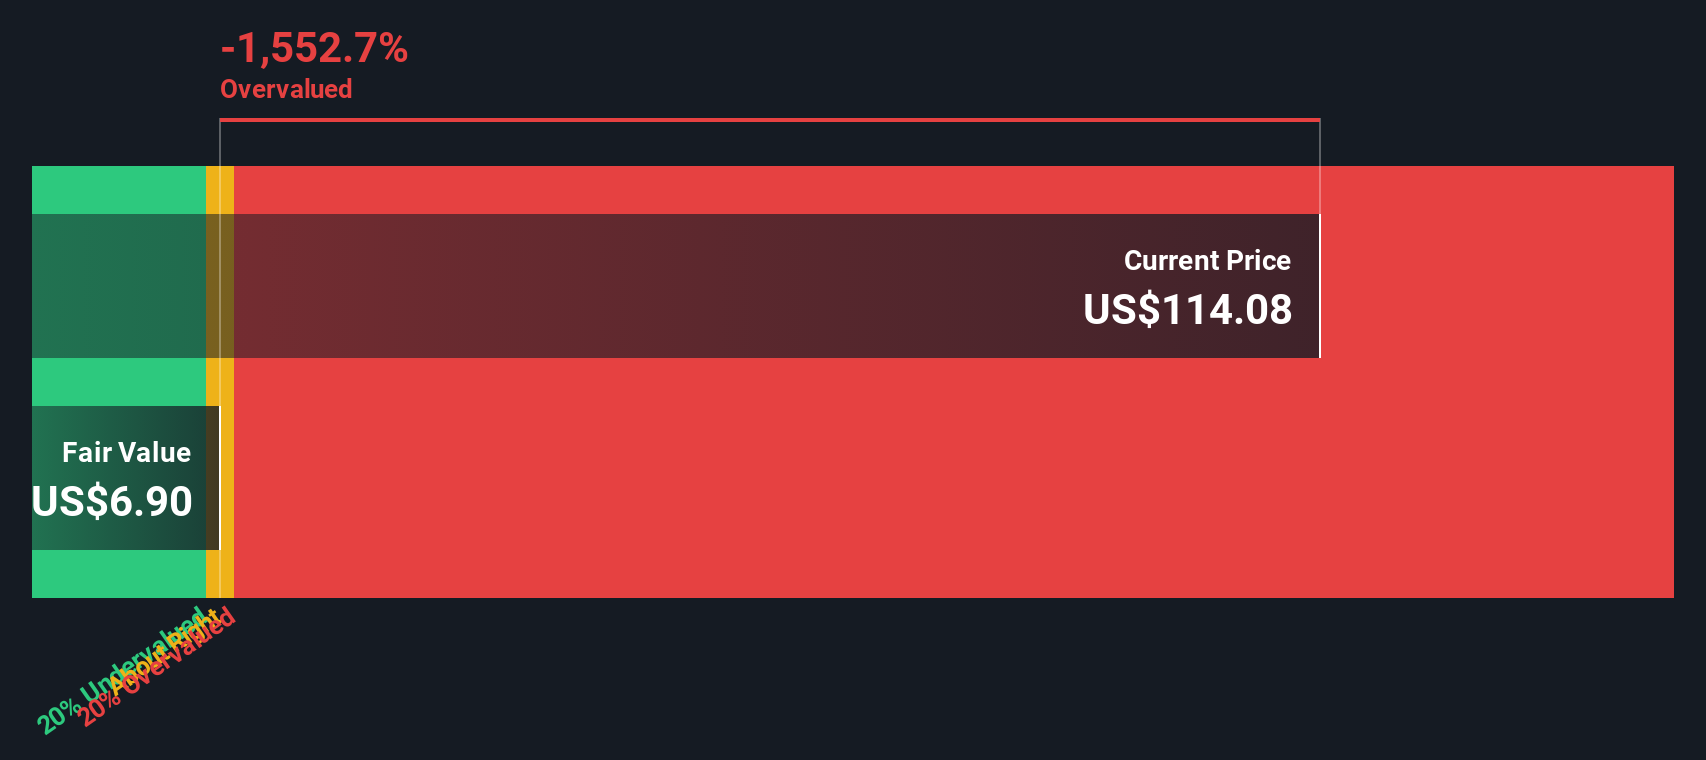
Another Angle: Cash Flows Paint a Tougher Picture
While the popular narrative leans on a $197.50 fair value, our DCF model currently points the other way, with an estimate of $76.98. On that view, Sanmina at $145.81 screens as overvalued. This raises a simple question for you: are the growth assumptions rich or just realistic?
Simply Wall St performs a discounted cash flow (DCF) on every stock in the world every day (check out Sanmina for example). We show the entire calculation in full. You can track the result in your watchlist or portfolio and be alerted when this changes, or use our stock screener to discover 53 high quality undervalued stocks. If you save a screener we even alert you when new companies match - so you never miss a potential opportunity.
Build Your Own Sanmina Narrative
If you see the numbers differently or simply prefer to test your own assumptions, you can build a fresh story in minutes: Do it your way.
A great starting point for your Sanmina research is our analysis highlighting 1 key reward and 2 important warning signs that could impact your investment decision.
Ready to uncover more investment ideas?
If Sanmina has sharpened your thinking, do not stop here. Use the Simply Wall Street Screener to spot other opportunities before they slip past you.
- Hunt for quality at a discount by scanning our list of 53 high quality undervalued stocks that pair solid fundamentals with prices that may not fully reflect them yet.
- Strengthen the defensive side of your portfolio by focusing on companies in our solid balance sheet and fundamentals stocks screener (45 results) that combine financial resilience with measured fundamentals.
- Get ahead of the crowd by checking our screener containing 23 high quality undiscovered gems that highlight lesser known companies with underlying metrics you might want to watch closely.
This article by Simply Wall St is general in nature. We provide commentary based on historical data and analyst forecasts only using an unbiased methodology and our articles are not intended to be financial advice. It does not constitute a recommendation to buy or sell any stock, and does not take account of your objectives, or your financial situation. We aim to bring you long-term focused analysis driven by fundamental data. Note that our analysis may not factor in the latest price-sensitive company announcements or qualitative material. Simply Wall St has no position in any stocks mentioned.