

Assessing St. Joe (JOE) Valuation As P/E Premium Contrasts With Discounted DCF Estimate
St. Joe Company JOE | 0.00 |
Setting the scene for St. Joe (JOE)
St. Joe (JOE) sits at the crossroads of residential, hospitality, and commercial real estate in Florida, and its recent share performance has drawn fresh attention from investors watching valuation and segment mix.
Recent trading has cooled, with the share price down 10.14% over the past 30 days and 8.80% over 90 days. However, a 49.16% 1 year total shareholder return hints that longer term momentum remains stronger than the short term pullback suggests.
If St. Joe’s recent moves have you thinking about where else growth and income could come from in real assets, broaden your search with the 20 top founder-led companies
With St. Joe trading at $63.81 and an estimated intrinsic value suggesting around a 47% discount, investors face a key question: is the stock still undervalued, or is the market already pricing in future growth?
Preferred P/E of 32.7x: Is it justified?
St. Joe trades on a P/E of 32.7x, which sits well above both its US Real Estate industry average of 29.4x and a peer average of 12.7x, even as the stock changes hands at $63.81.
The P/E multiple compares the current share price to earnings per share and is often used for real estate operators that already generate consistent profits, such as St. Joe with $112.1 million in net income on $518.1 million of revenue.
With earnings growing 44.2% over the past year, ahead of its 9.8% per year pace over five years, a higher P/E can reflect the market assigning a premium to that acceleration and to the 21.6% net margin. However, its 14.5% return on equity is still categorized as low.
Compared with the broader US Real Estate industry average P/E of 29.4x and a much lower peer average of 12.7x, the current 32.7x reading places St. Joe at the expensive end of the range. This suggests investors are paying up relative to sector and peer benchmarks for its earnings profile.
Result: Preferred multiple of Price-to-Earnings of 32.7x (OVERVALUED)
However, this premium could be tested if real estate demand in Florida cools or if St. Joe’s Residential and Hospitality segments experience slower homesite and hotel activity.
Another view on value: what the DCF suggests
While the current P/E of 32.7x makes St. Joe look expensive versus both the US Real Estate industry on 29.4x and peers on 12.7x, the SWS DCF model points the other way. With an estimated fair value of $120.27, the stock at $63.81 screens as trading at a steep discount.
For investors, that split between an expensive earnings multiple and what our DCF model suggests as undervalued raises a simple question: which lens do you trust more for a business like this, earnings today or potential future cash flows?
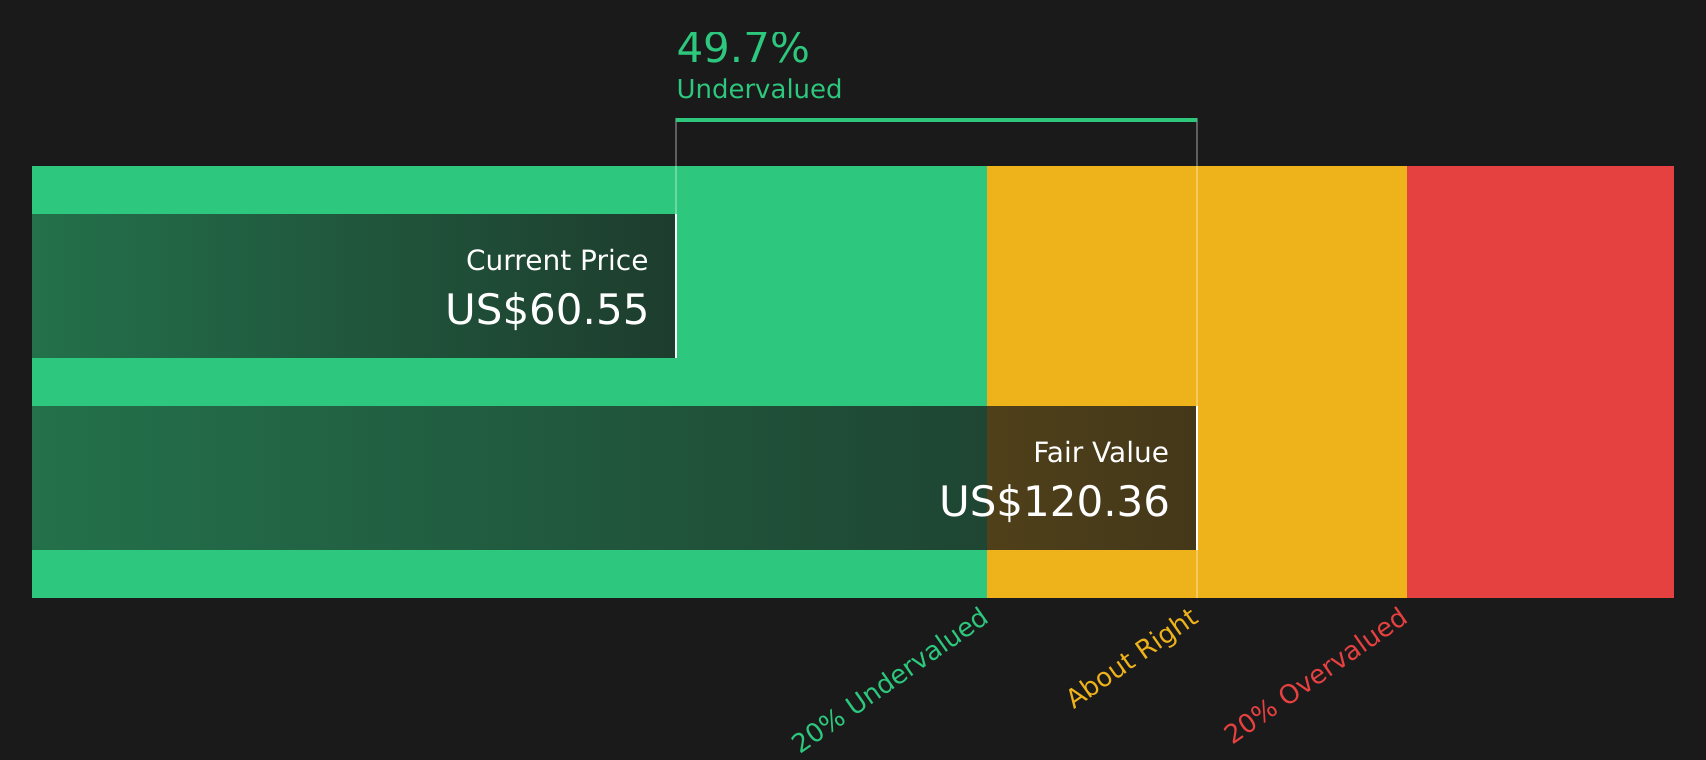
Simply Wall St performs a discounted cash flow (DCF) on every stock in the world every day (check out St. Joe for example). We show the entire calculation in full. You can track the result in your watchlist or portfolio and be alerted when this changes, or use our stock screener to discover 48 high quality undervalued stocks. If you save a screener we even alert you when new companies match - so you never miss a potential opportunity.
Next Steps
Mixed messages on value and expectations can be confusing, so check the underlying figures, compare the signals, and then weigh the 2 key rewards and 1 important warning sign.
Looking for more investment ideas?
If St. Joe has sharpened your focus on quality, do not stop here, the broader market still holds plenty of stocks that could better fit your goals.
- Target resilient income by reviewing companies in the 10 dividend fortresses to see which yield focused ideas might suit your portfolio.
- Spot potential mispricings by scanning the 48 high quality undervalued stocks and compare how other stocks stack up on quality and price.
- Strengthen your core holdings by checking the solid balance sheet and fundamentals stocks screener (46 results) and focus on businesses with sturdier financial foundations.
This article by Simply Wall St is general in nature. We provide commentary based on historical data and analyst forecasts only using an unbiased methodology and our articles are not intended to be financial advice. It does not constitute a recommendation to buy or sell any stock, and does not take account of your objectives, or your financial situation. We aim to bring you long-term focused analysis driven by fundamental data. Note that our analysis may not factor in the latest price-sensitive company announcements or qualitative material. Simply Wall St has no position in any stocks mentioned.