Assessing Viking Therapeutics (VKTX) Valuation After VK2735 Phase 2 Success And Phase 3 Trial Progress
Viking Therapeutics, Inc. VKTX | 34.80 | +5.58% |
Why VK2735’s latest trial results matter for Viking Therapeutics (VKTX)
Viking Therapeutics (VKTX) is back in focus after publishing Phase 2 VENTURE trial results for its dual GLP-1/GIP candidate VK2735 and confirming full enrollment in two large Phase 3 obesity and diabetes studies.
VKTX’s share price has been choppy around the latest VK2735 updates, with a 7 day share price return of 4.71% but a 30 day share price return of 8.32% and a year to date share price return of a 5.76% decline, while the 3 year total shareholder return of almost 3x suggests longer term momentum has been strong even if recent gains have cooled.
If obesity drug news has caught your attention, it could be a good moment to see how Viking compares with other healthcare stocks that are also trying to reshape treatment options.
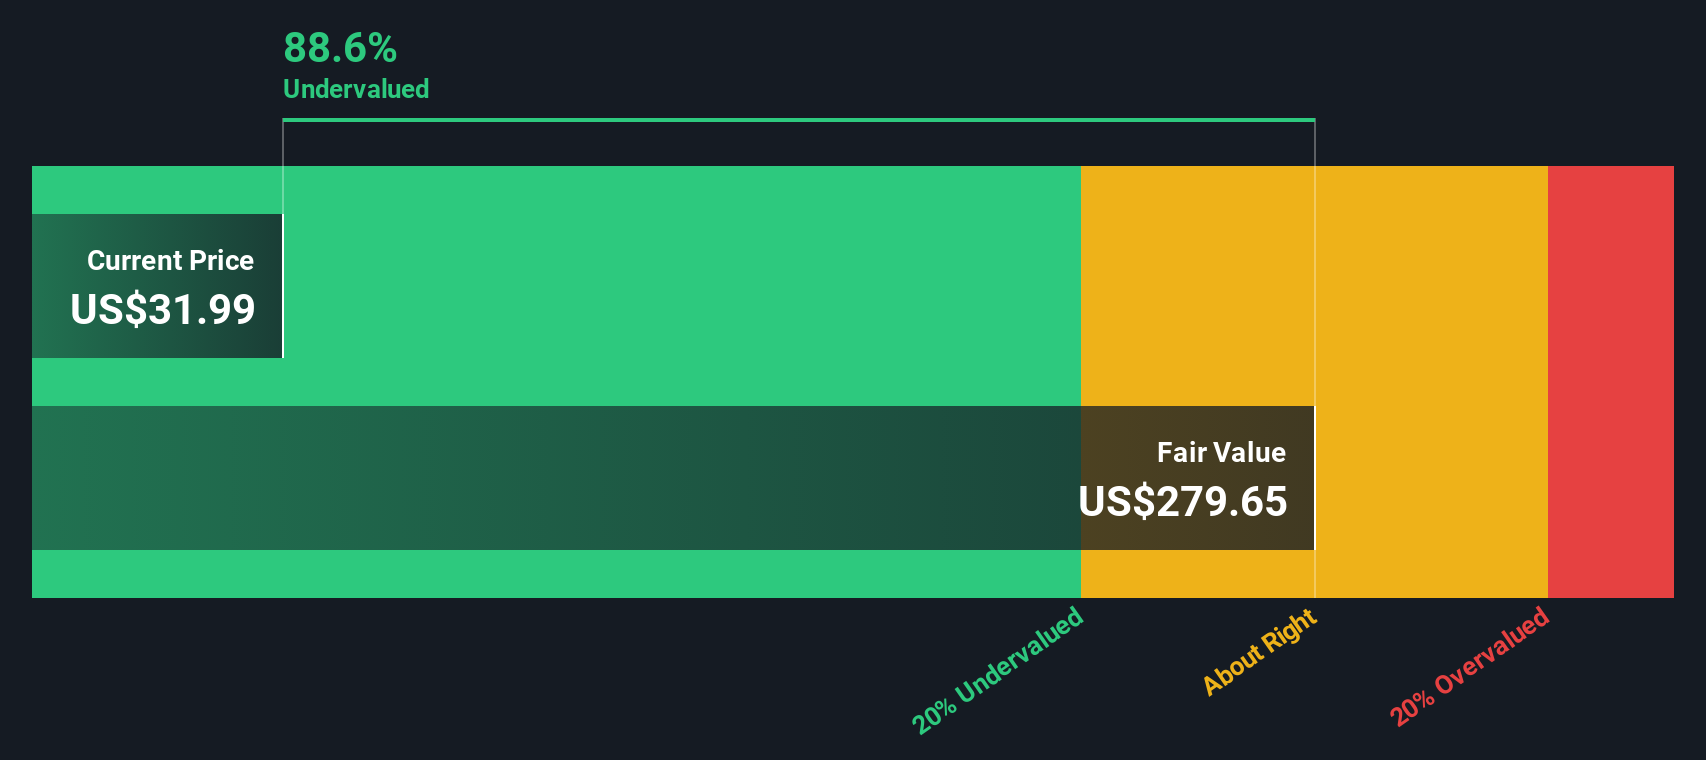
With VKTX trading at about US$33.38 and an implied discount to some analyst targets plus an intrinsic value gap, you have to ask: is Viking quietly undervalued here, or is the market already baking in future growth?
Price-to-book of 5.3x, is it justified?
On a P/B basis, Viking trades at 5.3x, while our DCF model points to a fair value of about US$276.53 per share versus the last close of US$33.38.
The P/B ratio compares the company’s market value to its book value. It is often used for asset light, early stage biopharma names that are not yet generating meaningful revenue. At 5.3x, investors are effectively paying several times Viking’s accounting equity for exposure to its research pipeline rather than current earnings.
Compared with peers, Viking’s 5.3x P/B is above both the peer group average of 5x and the broader US Biotechs industry average of 2.7x. This suggests the market is assigning a richer valuation relative to balance sheet value than it does for many competitors.
Result: Price-to-book of 5.3x (OVERVALUED)
However, you also have to weigh binary clinical outcomes and ongoing net losses of US$237.394 million, which could both shift sentiment around that apparent valuation gap.
Another view: what the DCF model suggests
While the 5.3x P/B ratio makes VKTX look expensive against peers, our DCF model paints a very different picture. On that approach, VKTX at about US$33.38 is trading roughly 87.9% below an implied fair value of around US$276.53 per share, which screens as heavily undervalued.
Two methods, two very different answers, so which one do you think better reflects the risk that VK2735 and the broader pipeline never fully translate into cash flows?
Simply Wall St performs a discounted cash flow (DCF) on every stock in the world every day (check out Viking Therapeutics for example). We show the entire calculation in full. You can track the result in your watchlist or portfolio and be alerted when this changes, or use our stock screener to discover 876 undervalued stocks based on their cash flows. If you save a screener we even alert you when new companies match - so you never miss a potential opportunity.
Build Your Own Viking Therapeutics Narrative
If this perspective does not fully align with your view, or you would rather examine the data yourself, you can shape a personalized thesis in minutes with Do it your way.
A great starting point for your Viking Therapeutics research is our analysis highlighting 1 key reward and 3 important warning signs that could impact your investment decision.
Looking for more investment ideas?
If Viking has sparked your interest, do not stop here. Broaden your watchlist with other angles on growth, income, and long term themes using the Simply Wall St Screener.
- Spot potential turnarounds early by scanning these 3536 penny stocks with strong financials that combine smaller market caps with stronger fundamentals than you might expect.
- Ride the AI wave more thoughtfully by checking out these 23 AI penny stocks that focus on real business use cases rather than just hype.
- Strengthen your income ideas by reviewing these 13 dividend stocks with yields > 3% that already offer yields above 3% and may suit a cash flow focused portfolio.
This article by Simply Wall St is general in nature. We provide commentary based on historical data and analyst forecasts only using an unbiased methodology and our articles are not intended to be financial advice. It does not constitute a recommendation to buy or sell any stock, and does not take account of your objectives, or your financial situation. We aim to bring you long-term focused analysis driven by fundamental data. Note that our analysis may not factor in the latest price-sensitive company announcements or qualitative material. Simply Wall St has no position in any stocks mentioned.